Citibank 2011 Annual Report Download - page 192
Download and view the complete annual report
Please find page 192 of the 2011 Citibank annual report below. You can navigate through the pages in the report by either clicking on the pages listed below, or by using the keyword search tool below to find specific information within the annual report.-
 1
1 -
2
-
3
-
4
-
5
-
6
-
7
-
8
-
9
-
10
-
11
-
12
-
13
-
14
-
15
-
16
-
17
-
18
-
19
-
20
-
21
-
22
-
23
-
24
-
25
-
26
-
27
-
28
-
29
-
30
-
31
-
32
-
33
-
34
-
35
-
36
-
37
-
38
-
39
-
40
-
41
-
42
-
43
-
44
-
45
-
46
-
47
-
48
-
49
-
50
-
51
-
52
-
53
-
54
-
55
-
56
-
57
-
58
-
59
-
60
-
61
-
62
-
63
-
64
-
65
-
66
-
67
-
68
-
69
-
70
-
71
-
72
-
73
-
74
-
75
-
76
-
77
-
78
-
79
-
80
-
81
-
82
-
83
-
84
-
85
-
86
-
87
-
88
-
89
-
90
-
91
-
92
-
93
-
94
-
95
-
96
-
97
-
98
-
99
-
100
-
101
-
102
-
103
-
104
-
105
-
106
-
107
-
108
-
109
-
110
-
111
-
112
-
113
-
114
-
115
-
116
-
117
-
118
-
119
-
120
-
121
-
122
-
123
-
124
-
125
-
126
-
127
-
128
-
129
-
130
-
131
-
132
-
133
-
134
-
135
-
136
-
137
-
138
-
139
-
140
-
141
-
142
-
143
-
144
-
145
-
146
-
147
-
148
-
149
-
150
-
151
-
152
-
153
-
154
-
155
-
156
-
157
-
158
-
159
-
160
-
161
-
162
-
163
-
164
-
165
-
166
-
167
-
168
-
169
-
170
-
171
-
172
-
173
-
174
-
175
-
176
-
177
-
178
-
179
-
180
-
181
-
 182
182 -
 183
183 -
 184
184 -
 185
185 -
 186
186 -
 187
187 -
 188
188 -
 189
189 -
 190
190 -
 191
191 -
 192
192 -
 193
193 -
 194
194 -
 195
195 -
 196
196 -
 197
197 -
 198
198 -
 199
199 -
 200
200 -
 201
201 -
 202
202 -
203
-
204
-
205
-
206
-
207
-
208
-
209
-
210
-
211
-
212
-
213
-
214
-
215
-
216
-
217
-
218
-
219
-
220
-
221
-
222
-
223
-
224
-
225
-
226
-
227
-
228
-
229
-
230
-
231
-
232
-
233
-
234
-
235
-
236
-
237
-
238
-
239
-
240
-
241
-
242
-
243
-
244
-
245
-
246
-
247
-
248
-
249
-
250
-
251
-
252
-
253
-
254
-
255
-
256
-
257
-
258
-
259
-
260
-
261
-
262
-
263
-
264
-
265
-
266
-
267
-
268
-
269
-
270
-
271
-
272
-
273
-
274
-
275
-
276
-
277
-
278
-
279
-
280
-
281
-
282
-
283
-
284
-
285
-
286
-
287
-
288
-
289
-
290
-
291
-
292
-
293
-
294
-
295
-
296
-
297
-
298
-
299
-
300
-
301
-
302
-
303
-
304
-
305
-
306
-
307
-
308
-
309
-
310
-
311
-
312
-
313
-
314
-
315
-
316
-
317
-
318
-
319
-
320
 |
 |

170
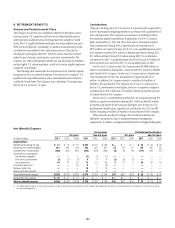
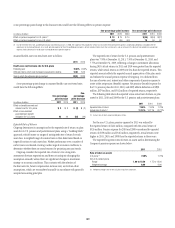
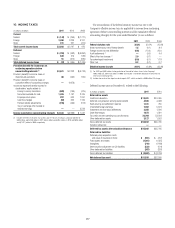
A one-percentage-point change in the expected rates of return would have the following effects on pension expense:
One-percentage-point increase One-percentage-point decrease
In millions of dollars 2011 2011
%FFECTæONæPENSIONæEXPENSEæFORæ53æPLANS $(118) $ 118
%FFECTæONæPENSIONæEXPENSEæFORæNON53æPLANS (62) 62 æ æ
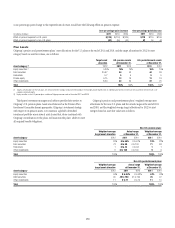
Plan Assets
Citigroup’s pension and postretirement plans’ asset allocations for the U.S. plans at the end of 2011 and 2010, and the target allocations for 2012 by asset
category based on asset fair values, are as follows:
Target asset
allocation
U.S. pension assets
at December 31,
U.S. postretirement assets
at December 31,
Asset category (1) 2011 2011
%QUITYæSECURITIESæ 16% 16%
$EBTæSECURITIES 44 44
2EALæESTATE 55
0RIVATEæEQUITY 13 13
/THERæINVESTMENTS 22 22
Total 100% 100%
æ 4ARGETæASSETæALLOCATIONSæFORæTHEæ53æPLANSæAREæSETæBYæINVESTMENTæSTRATEGYæNOTæBYæINVESTMENTæPRODUCTæ&ORæEXAMPLEæPRIVATEæEQUITIESæWITHæANæUNDERLYINGæINVESTMENTæINæREALæESTATEæAREæCLASSIFIEDæINæTHEæREALæESTATEæASSETæ
CATEGORYæNOTæPRIVATEæEQUITY
æ %QUITYæSECURITIESæINæTHEæ53æPENSIONæPLANSæINCLUDEæNOæ#ITIGROUPæCOMMONæSTOCKæATæTHEæENDæOFææANDæ
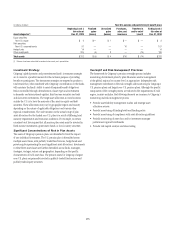
Third-party investment managers and advisors provide their services to
Citigroup’s U.S. pension plans. Assets are rebalanced as the Pension Plan
Investment Committee deems appropriate. Citigroup’s investment strategy,
with respect to its pension assets, is to maintain a globally diversified
investment portfolio across several asset classes that, when combined with
Citigroup’s contributions to the plans, will maintain the plans’ ability to meet
all required benefit obligations.
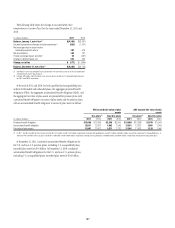
Citigroup’s pension and postretirement plans’ weighted-average asset
allocations for the non-U.S. plans and the actual ranges at the end of 2011
and 2010, and the weighted-average target allocations for 2012 by asset
category based on asset fair values are as follows:
Non-U.S. pension plans
Weighted-average
target asset allocation
Actual range
at December 31,
Weighted-average
at December 31,
Asset category 2011 2011
%QUITYæSECURITIES 0 to 65% ææTOæ 19%
$EBTæSECURITIES 0 to 99 æTOæ 71
2EALæESTATE 0 to 42 ææTOæ 1
/THERæINVESTMENTS 0 to 100 æTOæ 9
Total 100%
Non-U.S. postretirement plans
Weighted-average
target asset allocation
Actual range
at December 31,
Weighted-average
at December 31,
Asset category 2011 2011
%QUITYæSECURITIES 0 to 44% æTOæ 44%
$EBTæSECURITIES 45 to 100 æTOæ 45
/THERæINVESTMENTS 0 to 11 æTOæ 11
Total 100% æ