Citibank 2011 Annual Report Download - page 139
Download and view the complete annual report
Please find page 139 of the 2011 Citibank annual report below. You can navigate through the pages in the report by either clicking on the pages listed below, or by using the keyword search tool below to find specific information within the annual report.-
 1
1 -
2
-
3
-
4
-
5
-
6
-
7
-
8
-
9
-
10
-
11
-
12
-
13
-
14
-
15
-
16
-
17
-
18
-
19
-
20
-
21
-
22
-
23
-
24
-
25
-
26
-
27
-
28
-
29
-
30
-
31
-
32
-
33
-
34
-
35
-
36
-
37
-
38
-
39
-
40
-
41
-
42
-
43
-
44
-
45
-
46
-
47
-
48
-
49
-
50
-
51
-
52
-
53
-
54
-
55
-
56
-
57
-
58
-
59
-
60
-
61
-
62
-
63
-
64
-
65
-
66
-
67
-
68
-
69
-
70
-
71
-
72
-
73
-
74
-
75
-
76
-
77
-
78
-
79
-
80
-
81
-
82
-
83
-
84
-
85
-
86
-
87
-
88
-
89
-
90
-
91
-
92
-
93
-
94
-
95
-
96
-
97
-
98
-
99
-
100
-
101
-
102
-
103
-
104
-
105
-
106
-
107
-
108
-
109
-
110
-
111
-
112
-
113
-
114
-
115
-
116
-
117
-
118
-
119
-
120
-
121
-
122
-
123
-
124
-
125
-
126
-
127
-
128
-
 129
129 -
 130
130 -
 131
131 -
 132
132 -
 133
133 -
 134
134 -
 135
135 -
 136
136 -
 137
137 -
 138
138 -
 139
139 -
 140
140 -
 141
141 -
 142
142 -
 143
143 -
 144
144 -
 145
145 -
 146
146 -
 147
147 -
 148
148 -
 149
149 -
150
-
151
-
152
-
153
-
154
-
155
-
156
-
157
-
158
-
159
-
160
-
161
-
162
-
163
-
164
-
165
-
166
-
167
-
168
-
169
-
170
-
171
-
172
-
173
-
174
-
175
-
176
-
177
-
178
-
179
-
180
-
181
-
182
-
183
-
184
-
185
-
186
-
187
-
188
-
189
-
190
-
191
-
192
-
193
-
194
-
195
-
196
-
197
-
198
-
199
-
200
-
201
-
202
-
203
-
204
-
205
-
206
-
207
-
208
-
209
-
210
-
211
-
212
-
213
-
214
-
215
-
216
-
217
-
218
-
219
-
220
-
221
-
222
-
223
-
224
-
225
-
226
-
227
-
228
-
229
-
230
-
231
-
232
-
233
-
234
-
235
-
236
-
237
-
238
-
239
-
240
-
241
-
242
-
243
-
244
-
245
-
246
-
247
-
248
-
249
-
250
-
251
-
252
-
253
-
254
-
255
-
256
-
257
-
258
-
259
-
260
-
261
-
262
-
263
-
264
-
265
-
266
-
267
-
268
-
269
-
270
-
271
-
272
-
273
-
274
-
275
-
276
-
277
-
278
-
279
-
280
-
281
-
282
-
283
-
284
-
285
-
286
-
287
-
288
-
289
-
290
-
291
-
292
-
293
-
294
-
295
-
296
-
297
-
298
-
299
-
300
-
301
-
302
-
303
-
304
-
305
-
306
-
307
-
308
-
309
-
310
-
311
-
312
-
313
-
314
-
315
-
316
-
317
-
318
-
319
-
320
 |
 |
117
Regardless of the classification of the securities as available-for-sale or
held-to-maturity, Citi assesses each position with an unrealized loss for OTTI.
Management assesses equity method investments with fair value less
than carrying value for OTTI, as discussed in Note 15 to the Consolidated
Financial Statements. For investments that management does not plan to sell
prior to recovery of value, or Citi is not likely to be required to sell, various
factors are considered in assessing OTTI. For investments that Citi plans to
sell prior to recovery of value, or would likely be required to sell and there
is no expectation that the fair value will recover prior to the expected sale
date, the full impairment would be recognized in the Consolidated Statement
of Income.
At December 31, 2011, Citi had several equity method investments that
had temporary impairment, including its investments in Akbank and the
Morgan Stanley Smith Barney joint venture. As of December 31, 2011,
management does not plan to sell those investments prior to recovery of
value and it is not more likely than not that Citi will be required to sell those
investments. For additional information on these equity method investments,
see Note 15 to the Consolidated Financial Statements (Evaluating
Investments for Other-Than-Temporary Impairments) below.
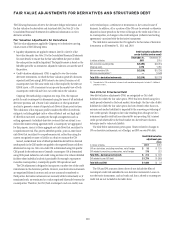
CVA/DVA Methodology
ASC 820-10 requires that Citi’s own credit risk be considered in determining
the market value of any Citi liability carried at fair value. These liabilities
include derivative instruments as well as debt and other liabilities for which
the fair value option has been elected. The credit valuation adjustment (CVA)
is recognized on the balance sheet as a reduction or increase in the associated
derivative asset or liability to arrive at the fair value (carrying value) of
the derivative asset or liability. The debt valuation adjustment (DVA) is
recognized on the balance sheet as a reduction or increase in the associated
fair value option debt liability to arrive at the fair value of the liability. For
additional information, see “Fair Value Adjustments for Derivatives and
Structured Debt” above.
Allowance for Credit Losses
Allowance for Funded Lending Commitments
Management provides reserves for an estimate of probable losses inherent
in the funded loan portfolio on the Consolidated Balance Sheet in the
form of an allowance for loan losses. These reserves are established in
accordance with Citigroup’s credit reserve policies, as approved by the
Audit Committee of the Board of Directors. Citi’s Chief Risk Officer and
Chief Financial Officer review the adequacy of the credit loss reserves each
quarter with representatives from the risk management and finance staffs
for each applicable business area. Applicable business areas include those
having classifiably managed portfolios, where internal credit-risk ratings
are assigned (primarily Institutional Clients Group and Global Consumer
Banking), or modified Consumer loans, where concessions were granted due
to the borrowers’ financial difficulties.
The above-mentioned representatives covering these respective business
areas present recommended reserve balances for their funded and unfunded
lending portfolios along with supporting quantitative and qualitative data.
The quantitative data include:
Estimated probable losses for non-performing, non-homogeneous
exposures within a business line’s classifiably managed portfolio
and impaired smaller-balance homogeneous loans whose terms
have been modified due to the borrowers’ financial difficulties, where
it was determined that a concession was granted to the borrower.
Consideration may be given to the following, as appropriate, when
determining this estimate: (i) the present value of expected future cash
flows discounted at the loan’s original effective rate; (ii) the borrower’s
overall financial condition, resources and payment record; and (iii) the
prospects for support from financially responsible guarantors or the
realizable value of any collateral. When impairment is measured based
on the present value of expected future cash flows, the entire change in
present value is recorded in the Provision for loan losses.
Statistically calculated losses inherent in the classifiably managed
portfolio for performing and de minimis non-performing exposures.
The calculation is based upon: (i) Citigroup’s internal system of credit-risk
ratings, which are analogous to the risk ratings of the major credit rating
agencies; and (ii) historical default and loss data, including rating agency
information regarding default rates from 1983 to 2011, and internal data
dating to the early 1970s on severity of losses in the event of default.
Additional adjustments. These include: (i) statistically calculated
estimates to cover the historical fluctuation of the default rates over the
credit cycle, the historical variability of loss severity among defaulted
loans, and the degree to which there are large obligor concentrations in
the global portfolio; and (ii) adjustments made for specifically known
items, such as current environmental factors and credit trends.
In addition, representatives from both the risk management and finance
staffs that cover business areas with delinquency-managed portfolios
containing smaller homogeneous loans present their recommended reserve
balances based upon leading credit indicators, including loan delinquencies
and changes in portfolio size, as well as economic trends, including housing
prices, unemployment and GDP. This methodology is applied separately for
each individual product within each different geographic region in which
these portfolios exist.