Citibank 2011 Annual Report Download - page 57
Download and view the complete annual report
Please find page 57 of the 2011 Citibank annual report below. You can navigate through the pages in the report by either clicking on the pages listed below, or by using the keyword search tool below to find specific information within the annual report.-
 1
1 -
2
-
3
-
4
-
5
-
6
-
7
-
8
-
9
-
10
-
11
-
12
-
13
-
14
-
15
-
16
-
17
-
18
-
19
-
20
-
21
-
22
-
23
-
24
-
25
-
26
-
27
-
28
-
29
-
30
-
31
-
32
-
33
-
34
-
35
-
36
-
37
-
38
-
39
-
40
-
41
-
42
-
43
-
44
-
45
-
46
-
 47
47 -
 48
48 -
 49
49 -
 50
50 -
 51
51 -
 52
52 -
 53
53 -
 54
54 -
 55
55 -
 56
56 -
 57
57 -
 58
58 -
 59
59 -
 60
60 -
 61
61 -
 62
62 -
 63
63 -
 64
64 -
 65
65 -
 66
66 -
 67
67 -
68
-
69
-
70
-
71
-
72
-
73
-
74
-
75
-
76
-
77
-
78
-
79
-
80
-
81
-
82
-
83
-
84
-
85
-
86
-
87
-
88
-
89
-
90
-
91
-
92
-
93
-
94
-
95
-
96
-
97
-
98
-
99
-
100
-
101
-
102
-
103
-
104
-
105
-
106
-
107
-
108
-
109
-
110
-
111
-
112
-
113
-
114
-
115
-
116
-
117
-
118
-
119
-
120
-
121
-
122
-
123
-
124
-
125
-
126
-
127
-
128
-
129
-
130
-
131
-
132
-
133
-
134
-
135
-
136
-
137
-
138
-
139
-
140
-
141
-
142
-
143
-
144
-
145
-
146
-
147
-
148
-
149
-
150
-
151
-
152
-
153
-
154
-
155
-
156
-
157
-
158
-
159
-
160
-
161
-
162
-
163
-
164
-
165
-
166
-
167
-
168
-
169
-
170
-
171
-
172
-
173
-
174
-
175
-
176
-
177
-
178
-
179
-
180
-
181
-
182
-
183
-
184
-
185
-
186
-
187
-
188
-
189
-
190
-
191
-
192
-
193
-
194
-
195
-
196
-
197
-
198
-
199
-
200
-
201
-
202
-
203
-
204
-
205
-
206
-
207
-
208
-
209
-
210
-
211
-
212
-
213
-
214
-
215
-
216
-
217
-
218
-
219
-
220
-
221
-
222
-
223
-
224
-
225
-
226
-
227
-
228
-
229
-
230
-
231
-
232
-
233
-
234
-
235
-
236
-
237
-
238
-
239
-
240
-
241
-
242
-
243
-
244
-
245
-
246
-
247
-
248
-
249
-
250
-
251
-
252
-
253
-
254
-
255
-
256
-
257
-
258
-
259
-
260
-
261
-
262
-
263
-
264
-
265
-
266
-
267
-
268
-
269
-
270
-
271
-
272
-
273
-
274
-
275
-
276
-
277
-
278
-
279
-
280
-
281
-
282
-
283
-
284
-
285
-
286
-
287
-
288
-
289
-
290
-
291
-
292
-
293
-
294
-
295
-
296
-
297
-
298
-
299
-
300
-
301
-
302
-
303
-
304
-
305
-
306
-
307
-
308
-
309
-
310
-
311
-
312
-
313
-
314
-
315
-
316
-
317
-
318
-
319
-
320
 |
 |

35
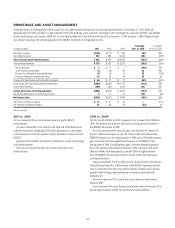
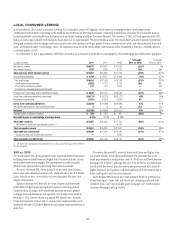
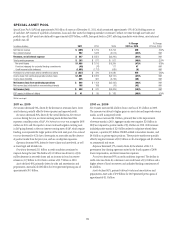
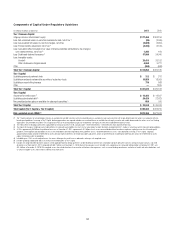
SPECIAL ASSET POOL
Special Asset Pool (SAP) had approximately $41 billion of assets as of December 31, 2011, which constituted approximately 15% of Citi Holdings assets as
of such date. SAP consists of a portfolio of securities, loans and other assets that Citigroup intends to continue to reduce over time through asset sales and
portfolio run-off. SAP assets have declined by approximately $287 billion, or 88%, from peak levels in 2007, reflecting cumulative write-downs, asset sales and
portfolio run-off.
In millions of dollars 2011
% Change
2011 vs. 2010
æ#HANGEæ
æVSæ
.ETæINTERESTæREVENUE $ (405) NM
.ONINTERESTæREVENUE 952 (42)% .-
Revenues, net of interest expense $ 547 (81)% .-
4OTALæOPERATINGæEXPENSES $ 293 (49)%
.ETæCREDITæLOSSES $ 1,068 (47)%
0ROVISIONæRELEASESæFORæUNFUNDEDæLENDINGæCOMMITMENTS (40) 47 .-
#REDITæRESERVEæBUILDSæRELEASES (1,855) (8) .-
0ROVISIONSæFORæCREDITæLOSSESæANDæFORæBENEFITSæANDæCLAIMS $ (827) NM
)NCOMEæLOSSæFROMæCONTINUINGæOPERATIONSæBEFOREæTAXES $ 1,081 (47)% .-
)NCOMEæTAXESæBENEFITS 485 (46) .-
Net income (loss) from continuing operations $ 596 (49)% .-
.ETæINCOMEæLOSSæATTRIBUTABLEæTOæNONCONTROLLINGæINTERESTS 108 (43) .-
Net income (loss) $ 488 (50)% .-
%/0æASSETSæ(in billions of dollars) $41 (49)%
.-æ.OTæMEANINGFUL
2011 vs. 2010
Net income decreased 50%, driven by the decrease in revenues due to lower
asset balances, partially offset by lower expenses and improved credit.
Revenues decreased 81%, driven by the overall decline in Net interest
revenue during the year, as interest-earning assets declined and thus
represent a smaller portion of SAP. Net interest revenue was a negative $405
million in 2011 and Citi expects to incur continued negative carrying costs
in SAP going forward as the non-interest-earning assets of SAP, which require
funding, now represent the larger portion of the total asset pool. Non-interest
revenue decreased by 42% due to lower gains on asset sales and the absence
of positive marks from the prior year, such as on subprime exposures.
Expenses decreased 49%, driven by lower volume and asset levels, as well
as lower legal and related costs.
Provisions decreased $1.1 billion as credit conditions continued to
improve during the year. The decline of $1.1 billion was driven by a $945
million decrease in net credit losses and an increase in loan loss reserve
releases to $1.9 billion in 2011 from a release of $1.7 billion in 2010.
Assets declined 49%, primarily driven by sales and amortization and
prepayments. Asset sales of $29 billion for 2011 generated pretax gains of
approximately $0.5 billion.
2010 vs. 2009
Net income increased $6.4 billion from a net loss of $5.4 billion in 2009.
The increase was driven by higher gains on asset sales and improved revenue
marks, as well as improved credit.
Revenues increased $6.1 billion, primarily due to the improvement
of revenue marks in 2010. Aggregate marks were negative $2.6 billion in
2009 as compared to positive marks of $3.4 billion in 2010. 2010 revenues
included positive marks of $2.0 billion related to subprime-related direct
exposure, a positive $0.5 billion CVA/DVA related to monoline insurers, and
$0.4 billion on private equity positions. These positive marks were partially
offset by negative revenues of $0.5 billion on Alt-A mortgages and $0.4 billion
on commercial real estate.
Expenses decreased 37%, mainly driven by the absence of the U.S.
government loss-sharing agreement exited in the fourth quarter of 2009,
lower compensation, and lower transaction expenses.
Provisions decreased 95% as credit conditions improved. The decline in
credit costs was driven by a decrease in net credit losses of $3.4 billion and a
higher release of loan loss reserves and unfunded lending commitments of
$1.4 billion.
Assets declined 41%, primarily driven by sales and amortization and
prepayments. Asset sales of $39 billion for 2010 generated pretax gains of
approximately $1.3 billion.