Citibank 2011 Annual Report Download - page 196
Download and view the complete annual report
Please find page 196 of the 2011 Citibank annual report below. You can navigate through the pages in the report by either clicking on the pages listed below, or by using the keyword search tool below to find specific information within the annual report.-
 1
1 -
2
-
3
-
4
-
5
-
6
-
7
-
8
-
9
-
10
-
11
-
12
-
13
-
14
-
15
-
16
-
17
-
18
-
19
-
20
-
21
-
22
-
23
-
24
-
25
-
26
-
27
-
28
-
29
-
30
-
31
-
32
-
33
-
34
-
35
-
36
-
37
-
38
-
39
-
40
-
41
-
42
-
43
-
44
-
45
-
46
-
47
-
48
-
49
-
50
-
51
-
52
-
53
-
54
-
55
-
56
-
57
-
58
-
59
-
60
-
61
-
62
-
63
-
64
-
65
-
66
-
67
-
68
-
69
-
70
-
71
-
72
-
73
-
74
-
75
-
76
-
77
-
78
-
79
-
80
-
81
-
82
-
83
-
84
-
85
-
86
-
87
-
88
-
89
-
90
-
91
-
92
-
93
-
94
-
95
-
96
-
97
-
98
-
99
-
100
-
101
-
102
-
103
-
104
-
105
-
106
-
107
-
108
-
109
-
110
-
111
-
112
-
113
-
114
-
115
-
116
-
117
-
118
-
119
-
120
-
121
-
122
-
123
-
124
-
125
-
126
-
127
-
128
-
129
-
130
-
131
-
132
-
133
-
134
-
135
-
136
-
137
-
138
-
139
-
140
-
141
-
142
-
143
-
144
-
145
-
146
-
147
-
148
-
149
-
150
-
151
-
152
-
153
-
154
-
155
-
156
-
157
-
158
-
159
-
160
-
161
-
162
-
163
-
164
-
165
-
166
-
167
-
168
-
169
-
170
-
171
-
172
-
173
-
174
-
175
-
176
-
177
-
178
-
179
-
180
-
181
-
182
-
183
-
184
-
185
-
 186
186 -
 187
187 -
 188
188 -
 189
189 -
 190
190 -
 191
191 -
 192
192 -
 193
193 -
 194
194 -
 195
195 -
 196
196 -
 197
197 -
 198
198 -
 199
199 -
 200
200 -
 201
201 -
 202
202 -
 203
203 -
 204
204 -
 205
205 -
 206
206 -
207
-
208
-
209
-
210
-
211
-
212
-
213
-
214
-
215
-
216
-
217
-
218
-
219
-
220
-
221
-
222
-
223
-
224
-
225
-
226
-
227
-
228
-
229
-
230
-
231
-
232
-
233
-
234
-
235
-
236
-
237
-
238
-
239
-
240
-
241
-
242
-
243
-
244
-
245
-
246
-
247
-
248
-
249
-
250
-
251
-
252
-
253
-
254
-
255
-
256
-
257
-
258
-
259
-
260
-
261
-
262
-
263
-
264
-
265
-
266
-
267
-
268
-
269
-
270
-
271
-
272
-
273
-
274
-
275
-
276
-
277
-
278
-
279
-
280
-
281
-
282
-
283
-
284
-
285
-
286
-
287
-
288
-
289
-
290
-
291
-
292
-
293
-
294
-
295
-
296
-
297
-
298
-
299
-
300
-
301
-
302
-
303
-
304
-
305
-
306
-
307
-
308
-
309
-
310
-
311
-
312
-
313
-
314
-
315
-
316
-
317
-
318
-
319
-
320
 |
 |

174
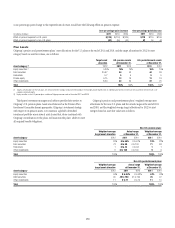
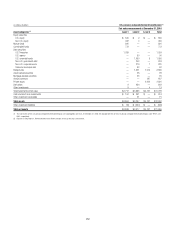
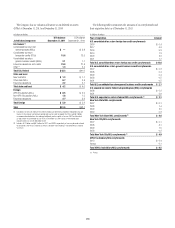
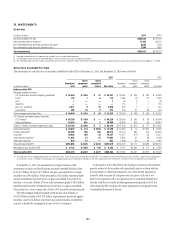
Level 3 Roll Forward
The reconciliations of the beginning and ending balances during the period for Level 3 assets are as follows:
In millions of dollars U.S. pension and postretirement benefit plans
Asset categories
Beginning Level 3
fair value at
Dec. 31, 2010
Realized
gains
(losses)
Unrealized
gains
(losses)
Purchases,
sales, and
issuances
Transfers in
and/or out of
Level 3
Ending Level 3
fair value at
Dec. 31, 2011
%QUITYæSECURITIES
53æEQUITY æ $— $— $ — $ 51 $ 51
.ON53æEQUITY — (1) — 20 19
$EBTæSECURITIES
53æCORPORATEæBONDSæ (2) (1) (1) 4 5
.ON53æCORPORATEæBONDS — — (1) — —
(EDGEæFUNDS 42 (45) (131) (10) 870
!NNUITYæCONTRACTS — 3 (35) — 155
0RIVATEæEQUITY 89 94 (497) (132) 2,474
/THERæINVESTMENTSæ — (6) — 123 121
Total investments $ 129 $ 44 $(665) $ 56 $ 3,695
/THERæINVESTMENTæRECEIVABLES — — 221 — 221
Total assets $ 129 $ 44 $(444) $ 56 $ 3,916
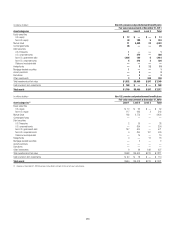
In millions of dollars U.S. pension and postretirement benefit plans
Asset categories
Beginning Level 3
fair value at
Dec. 31, 2009
Realized
gains
(losses)
Unrealized
gains
(losses)
Purchases,
sales, and
issuances
Transfers in
and/or out of
Level 3
Ending Level 3
fair value at
Dec. 31, 2010
%QUITYæSECURITIES
53æEQUITY ææææææ æ
.ON53æEQUITY
$EBTæSECURITIES
53æCORPORATEæBONDSæ
.ON53æCORPORATEæBONDS
(EDGEæFUNDS
!NNUITYæCONTRACTS
0RIVATEæEQUITY
/THERæINVESTMENTSæ
Total assets ææ
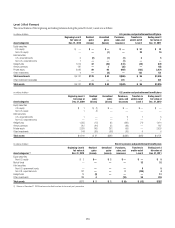
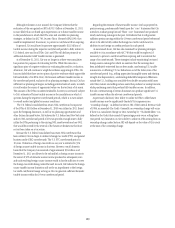
In millions of dollars Non-U.S. pension and postretirement benefit plans
Asset categories (1)
Beginning Level 3
fair value at
Dec. 31, 2010
Realized
gains
(losses)
Unrealized
gains
(losses)
Purchases,
sales, and
issuances
Transfers in
and/or out of
Level 3
Ending Level 3
fair value at
Dec. 31, 2011
%QUITYæSECURITIES
.ON53æEQUITY $— $ 2 $ — $ — $ 5
-UTUALæFUNDS ——— 32 32
$EBTæSECURITIES
.ON53æGOVERNMENTæBONDSæ ——— 5 5
.ONæ53æCORPORATEæBONDS — — 2 (105) 4
(EDGEæFUNDS (2) — — — 12
/THERæINVESTMENTS 4 (10) 56 239
Total assets $ 2 $ 2 $ (8) $ (12) $ 297
ææ "ALANCESæATæ$ECEMBERæææHAVEæBEENæRECLASSIFIEDæTOæCONFORMæTOæTHEæCURRENTæYEARSæPRESENTATION