Citibank 2011 Annual Report Download - page 218
Download and view the complete annual report
Please find page 218 of the 2011 Citibank annual report below. You can navigate through the pages in the report by either clicking on the pages listed below, or by using the keyword search tool below to find specific information within the annual report.-
 1
1 -
2
-
3
-
4
-
5
-
6
-
7
-
8
-
9
-
10
-
11
-
12
-
13
-
14
-
15
-
16
-
17
-
18
-
19
-
20
-
21
-
22
-
23
-
24
-
25
-
26
-
27
-
28
-
29
-
30
-
31
-
32
-
33
-
34
-
35
-
36
-
37
-
38
-
39
-
40
-
41
-
42
-
43
-
44
-
45
-
46
-
47
-
48
-
49
-
50
-
51
-
52
-
53
-
54
-
55
-
56
-
57
-
58
-
59
-
60
-
61
-
62
-
63
-
64
-
65
-
66
-
67
-
68
-
69
-
70
-
71
-
72
-
73
-
74
-
75
-
76
-
77
-
78
-
79
-
80
-
81
-
82
-
83
-
84
-
85
-
86
-
87
-
88
-
89
-
90
-
91
-
92
-
93
-
94
-
95
-
96
-
97
-
98
-
99
-
100
-
101
-
102
-
103
-
104
-
105
-
106
-
107
-
108
-
109
-
110
-
111
-
112
-
113
-
114
-
115
-
116
-
117
-
118
-
119
-
120
-
121
-
122
-
123
-
124
-
125
-
126
-
127
-
128
-
129
-
130
-
131
-
132
-
133
-
134
-
135
-
136
-
137
-
138
-
139
-
140
-
141
-
142
-
143
-
144
-
145
-
146
-
147
-
148
-
149
-
150
-
151
-
152
-
153
-
154
-
155
-
156
-
157
-
158
-
159
-
160
-
161
-
162
-
163
-
164
-
165
-
166
-
167
-
168
-
169
-
170
-
171
-
172
-
173
-
174
-
175
-
176
-
177
-
178
-
179
-
180
-
181
-
182
-
183
-
184
-
185
-
186
-
187
-
188
-
189
-
190
-
191
-
192
-
193
-
194
-
195
-
196
-
197
-
198
-
199
-
200
-
201
-
202
-
203
-
204
-
205
-
206
-
207
-
 208
208 -
 209
209 -
 210
210 -
 211
211 -
 212
212 -
 213
213 -
 214
214 -
 215
215 -
 216
216 -
 217
217 -
 218
218 -
 219
219 -
 220
220 -
 221
221 -
 222
222 -
 223
223 -
 224
224 -
 225
225 -
 226
226 -
 227
227 -
 228
228 -
229
-
230
-
231
-
232
-
233
-
234
-
235
-
236
-
237
-
238
-
239
-
240
-
241
-
242
-
243
-
244
-
245
-
246
-
247
-
248
-
249
-
250
-
251
-
252
-
253
-
254
-
255
-
256
-
257
-
258
-
259
-
260
-
261
-
262
-
263
-
264
-
265
-
266
-
267
-
268
-
269
-
270
-
271
-
272
-
273
-
274
-
275
-
276
-
277
-
278
-
279
-
280
-
281
-
282
-
283
-
284
-
285
-
286
-
287
-
288
-
289
-
290
-
291
-
292
-
293
-
294
-
295
-
296
-
297
-
298
-
299
-
300
-
301
-
302
-
303
-
304
-
305
-
306
-
307
-
308
-
309
-
310
-
311
-
312
-
313
-
314
-
315
-
316
-
317
-
318
-
319
-
320
 |
 |

196
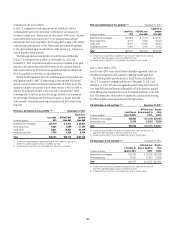
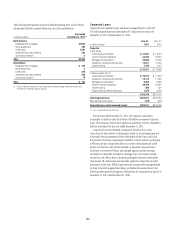
Consumer Credit Scores (FICO)
In the U.S., independent credit agencies rate an individual’s risk for
assuming debt based on the individual’s credit history and assign every
consumer a credit score. These scores are often called “FICO scores” because
most credit bureau scores used in the U.S. are produced from software
developed by Fair Isaac Corporation. Scores range from a high of 900 (which
indicates high credit quality) to 300. These scores are continually updated
by the agencies based upon an individual’s credit actions (e.g., taking out a
loan or missed or late payments).
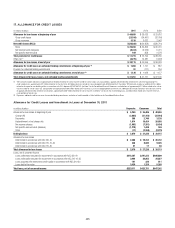
The following table provides details on the FICO scores attributable
to Citi’s U.S. Consumer loan portfolio as of December 31, 2011 and
December 31, 2010 (commercial market loans are not included in the table
since they are business-based and FICO scores are not a primary driver in
their credit evaluation). FICO scores are updated monthly for substantially
all of the portfolio or, otherwise, on a quarterly basis.
During the first quarter of 2011, the cards businesses (Citi-branded and
retail partner cards) in the U.S. began using a more updated FICO model
version to score customer accounts for substantially all of their loans. The
change was made to incorporate a more recent version of FICO in order to
improve the predictive strength of the score and to enhance Citi’s ability
to manage risk. In the first quarter, this change resulted in an increase in
the percentage of balances with FICO scores equal to or greater than 660
and conversely lowered the percentage of balances with FICO scores lower
than 620.
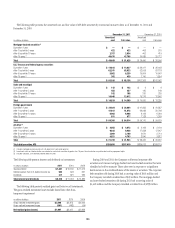
FICO score distribution in U.S. portfolio (1)(2) December 31, 2011
In millions of dollars
Less than
620
≥ 620 but less
than 660
Equal to or
greater
than 660
2ESIDENTIALæFIRSTæMORTGAGES $20,370 $ 8,815 $ 52,839
(OMEæEQUITYæLOANS 6,385 3,596 31,389
#REDITæCARDS 9,621 10,905 93,234
)NSTALLMENTæANDæOTHER 3,789 2,858 6,704
Total $40,165 $26,174 $184,166
æ %XCLUDESæLOANSæGUARANTEEDæBYæ53æGOVERNMENTæAGENCIESæLOANSæSUBJECTæTOæ,43#SæWITHæ53æ
GOVERNMENTSPONSOREDæAGENCIESæANDæLOANSæRECORDEDæATæFAIRæVALUE
æ %XCLUDESæBALANCESæWHEREæ&)#/æWASæNOTæAVAILABLEæ3UCHæAMOUNTSæAREæNOTæMATERIAL
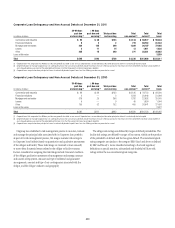
FICO score distribution in U.S. portfolio (1)(2) $ECEMBERææ
In millions of dollars
Less than
620
≥ 620 but less
than 660
Equal to or
greater
than 660
2ESIDENTIALæFIRSTæMORTGAGES
(OMEæEQUITYæLOANS
#REDITæCARDS
)NSTALLMENTæANDæOTHER
Total
æ %XCLUDESæLOANSæGUARANTEEDæBYæ53æGOVERNMENTæAGENCIESæLOANSæSUBJECTæTOæ,43#SæWITHæ53æ
GOVERNMENTSPONSOREDæAGENCIESæANDæLOANSæRECORDEDæATæFAIRæVALUE
æ %XCLUDESæBALANCESæWHEREæ&)#/æWASæNOTæAVAILABLEæ3UCHæAMOUNTSæAREæNOTæMATERIAL
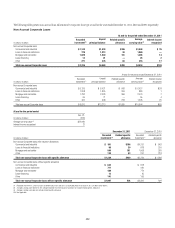
Loan to Value Ratios (LTV)
Loan to value (LTV) ratios (loan balance divided by appraised value) are
calculated at origination and updated by applying market price data.
The following tables provide details on the LTV ratios attributable to
Citi’s U.S. Consumer mortgage portfolios as of December 31, 2011 and
December 31, 2010. LTV ratios are updated monthly using the most recent
Core Logic HPI data available for substantially all of the portfolio applied
at the Metropolitan Statistical Area level, if available; otherwise, at the state
level. The remainder of the portfolio is updated in a similar manner using
the Office of Federal Housing Enterprise Oversight indices.
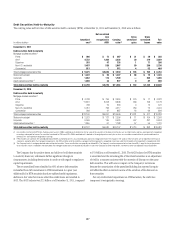
LTV distribution in U.S. portfolio (1)(2) December 31, 2011
In millions of dollars
Less than or
equal to 80%
> 80% but less
than or equal to
100%
Greater
than
100%
2ESIDENTIALæFIRSTæMORTGAGES $36,422 $ 21,146 $24,425
(OMEæEQUITYæLOANS 12,724 10,232 18,226
Total $49,146 $ 31,378 $42,651
æ %XCLUDESæLOANSæGUARANTEEDæBYæ53æGOVERNMENTæAGENCIESæLOANSæSUBJECTæTOæ,43#SæWITHæ53æ
GOVERNMENTSPONSOREDæAGENCIESæANDæLOANSæRECORDEDæATæFAIRæVALUE
æ %XCLUDESæBALANCESæWHEREæ,46æWASæNOTæAVAILABLEæ3UCHæAMOUNTSæAREæNOTæMATERIAL
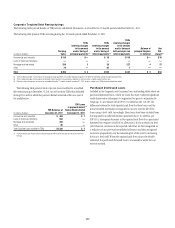
LTV distribution in U.S. portfolio (1)(2) $ECEMBERææ
In millions of dollars
Less than or
equal to 80%
> 80% but less
than or equal to
100%
Greater
than
100%
2ESIDENTIALæFIRSTæMORTGAGES
(OMEæEQUITYæLOANS
Total
æ %XCLUDESæLOANSæGUARANTEEDæBYæ53æGOVERNMENTæAGENCIESæLOANSæSUBJECTæTOæ,43#SæWITHæ53æ
GOVERNMENTSPONSOREDæAGENCIESæANDæLOANSæRECORDEDæATæFAIRæVALUE
æ %XCLUDESæBALANCESæWHEREæ,46æWASæNOTæAVAILABLEæ3UCHæAMOUNTSæAREæNOTæMATERIAL