Citibank 2011 Annual Report Download - page 38
Download and view the complete annual report
Please find page 38 of the 2011 Citibank annual report below. You can navigate through the pages in the report by either clicking on the pages listed below, or by using the keyword search tool below to find specific information within the annual report.-
 1
1 -
2
-
3
-
4
-
5
-
6
-
7
-
8
-
9
-
10
-
11
-
12
-
13
-
14
-
15
-
16
-
17
-
18
-
19
-
20
-
21
-
22
-
23
-
24
-
25
-
26
-
27
-
 28
28 -
 29
29 -
 30
30 -
 31
31 -
 32
32 -
 33
33 -
 34
34 -
 35
35 -
 36
36 -
 37
37 -
 38
38 -
 39
39 -
 40
40 -
 41
41 -
 42
42 -
 43
43 -
 44
44 -
 45
45 -
 46
46 -
 47
47 -
 48
48 -
49
-
50
-
51
-
52
-
53
-
54
-
55
-
56
-
57
-
58
-
59
-
60
-
61
-
62
-
63
-
64
-
65
-
66
-
67
-
68
-
69
-
70
-
71
-
72
-
73
-
74
-
75
-
76
-
77
-
78
-
79
-
80
-
81
-
82
-
83
-
84
-
85
-
86
-
87
-
88
-
89
-
90
-
91
-
92
-
93
-
94
-
95
-
96
-
97
-
98
-
99
-
100
-
101
-
102
-
103
-
104
-
105
-
106
-
107
-
108
-
109
-
110
-
111
-
112
-
113
-
114
-
115
-
116
-
117
-
118
-
119
-
120
-
121
-
122
-
123
-
124
-
125
-
126
-
127
-
128
-
129
-
130
-
131
-
132
-
133
-
134
-
135
-
136
-
137
-
138
-
139
-
140
-
141
-
142
-
143
-
144
-
145
-
146
-
147
-
148
-
149
-
150
-
151
-
152
-
153
-
154
-
155
-
156
-
157
-
158
-
159
-
160
-
161
-
162
-
163
-
164
-
165
-
166
-
167
-
168
-
169
-
170
-
171
-
172
-
173
-
174
-
175
-
176
-
177
-
178
-
179
-
180
-
181
-
182
-
183
-
184
-
185
-
186
-
187
-
188
-
189
-
190
-
191
-
192
-
193
-
194
-
195
-
196
-
197
-
198
-
199
-
200
-
201
-
202
-
203
-
204
-
205
-
206
-
207
-
208
-
209
-
210
-
211
-
212
-
213
-
214
-
215
-
216
-
217
-
218
-
219
-
220
-
221
-
222
-
223
-
224
-
225
-
226
-
227
-
228
-
229
-
230
-
231
-
232
-
233
-
234
-
235
-
236
-
237
-
238
-
239
-
240
-
241
-
242
-
243
-
244
-
245
-
246
-
247
-
248
-
249
-
250
-
251
-
252
-
253
-
254
-
255
-
256
-
257
-
258
-
259
-
260
-
261
-
262
-
263
-
264
-
265
-
266
-
267
-
268
-
269
-
270
-
271
-
272
-
273
-
274
-
275
-
276
-
277
-
278
-
279
-
280
-
281
-
282
-
283
-
284
-
285
-
286
-
287
-
288
-
289
-
290
-
291
-
292
-
293
-
294
-
295
-
296
-
297
-
298
-
299
-
300
-
301
-
302
-
303
-
304
-
305
-
306
-
307
-
308
-
309
-
310
-
311
-
312
-
313
-
314
-
315
-
316
-
317
-
318
-
319
-
320
 |
 |

16
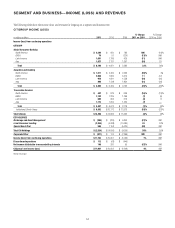
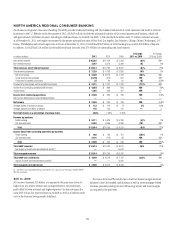
NORTH AMERICA REGIONAL CONSUMER BANKING
North America Regional Consumer Banking (NA RCB) provides traditional banking and Citi-branded card services to retail customers and small to mid-size
businesses in the U.S. Effective in the first quarter of 2012, NA RCB will also include the substantial majority of Citi’s retail partner cards business, which will
add approximately $45 billion of assets, including $41 billion of loans, to NA RCB. NA RCB’s 1,016 retail bank branches and 12.7 million customer accounts,
as of December 31, 2011, are largely concentrated in the greater metropolitan areas of New York, Los Angeles, San Francisco, Chicago, Miami, Washington, D.C.,
Boston, Philadelphia and certain larger cities in Texas. At December 31, 2011, NA RCB had $38.9 billion of retail banking loans and $148.8 billion of deposits.
In addition, NA RCB had 22.0 million Citi-branded credit card accounts, with $75.9 billion in outstanding card loan balances.
In millions of dollars 2011
% Change
2011 vs. 2010
æ#HANGEæ
æVSæ
.ETæINTERESTæREVENUE $ 10,367 (8)% .-
.ONINTERESTæREVENUE 3,247 (9)
Total revenues, net of interest expense $ 13,614 (8)%
4OTALæOPERATINGæEXPENSES $ 7,329 19%
.ETæCREDITæLOSSES $ 4,949 (38)% .-
#REDITæRESERVEæBUILDæRELEASE (2,740) NM .-
0ROVISIONSæFORæBENEFITSæANDæCLAIMS 22 (8)
0ROVISIONSæFORæLOANæLOSSESæANDæFORæBENEFITSæANDæCLAIMS $ 2,231 (71)% .-
)NCOMEæFROMæCONTINUINGæOPERATIONSæBEFOREæTAXES $ 4,054 NM
)NCOMEæTAXESæ 1,465 NM
Income from continuing operations $ 2,589 NM
.ETæINCOMEæATTRIBUTABLEæTOæNONCONTROLLINGæINTERESTS — —
Net income $ 2,589 NM
!VERAGEæASSETSæ(in billions of dollars) $ 123 3%
!VERAGEæDEPOSITS (in billions of dollars) 145 —
Net credit losses as a percentage of average loans 4.60%
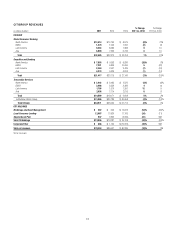
Revenue by business
2ETAILæBANKING $ 5,111 (4)%
#ITIBRANDEDæCARDS 8,503 (10) .-
Total $ 13,614 (8)%
Income (loss) from continuing operations by business
2ETAILæBANKING $ 488 (36)%
#ITIBRANDEDæCARDS 2,101 NM .-
Total $ 2,589 NM
Total GAAP revenues $ 13,614 (8)%
.ETæIMPACTæOFæCREDITæCARDæSECURITIZATIONSæACTIVITYæ —
Total managed revenues $ 13,614
Total GAAP net credit losses $ 4,949 (38)% .-
)MPACTæOFæCREDITæCARDæSECURITIZATIONSæACTIVITYæ —
Total managed net credit losses $ 4,949
ææ 3EEæ.OTEææTOæTHEæ#ONSOLIDATEDæ&INANCIALæ3TATEMENTSæFORæAæDISCUSSIONæOFæTHEæIMPACTæOFæ3&!3æ
.-æ .OTæMEANINGFUL
2011 vs. 2010
Net income increased $1.9 billion as compared to the prior year, driven by
higher loan loss reserve releases and an improvement in net credit losses,
partly offset by lower revenues and higher expenses. Citi does not expect the
same level of loan loss reserve releases in NA RCB in 2012 as it believes credit
costs in the business have generally stabilized.
Revenues decreased 8% mainly due to lower net interest margin and loan
balances in the Citi-branded cards business as well as lower mortgage-related
revenues, primarily relating to lower refinancing activity and lower margins
as compared to the prior year.