Citibank 2011 Annual Report Download - page 243
Download and view the complete annual report
Please find page 243 of the 2011 Citibank annual report below. You can navigate through the pages in the report by either clicking on the pages listed below, or by using the keyword search tool below to find specific information within the annual report.-
 1
1 -
2
-
3
-
4
-
5
-
6
-
7
-
8
-
9
-
10
-
11
-
12
-
13
-
14
-
15
-
16
-
17
-
18
-
19
-
20
-
21
-
22
-
23
-
24
-
25
-
26
-
27
-
28
-
29
-
30
-
31
-
32
-
33
-
34
-
35
-
36
-
37
-
38
-
39
-
40
-
41
-
42
-
43
-
44
-
45
-
46
-
47
-
48
-
49
-
50
-
51
-
52
-
53
-
54
-
55
-
56
-
57
-
58
-
59
-
60
-
61
-
62
-
63
-
64
-
65
-
66
-
67
-
68
-
69
-
70
-
71
-
72
-
73
-
74
-
75
-
76
-
77
-
78
-
79
-
80
-
81
-
82
-
83
-
84
-
85
-
86
-
87
-
88
-
89
-
90
-
91
-
92
-
93
-
94
-
95
-
96
-
97
-
98
-
99
-
100
-
101
-
102
-
103
-
104
-
105
-
106
-
107
-
108
-
109
-
110
-
111
-
112
-
113
-
114
-
115
-
116
-
117
-
118
-
119
-
120
-
121
-
122
-
123
-
124
-
125
-
126
-
127
-
128
-
129
-
130
-
131
-
132
-
133
-
134
-
135
-
136
-
137
-
138
-
139
-
140
-
141
-
142
-
143
-
144
-
145
-
146
-
147
-
148
-
149
-
150
-
151
-
152
-
153
-
154
-
155
-
156
-
157
-
158
-
159
-
160
-
161
-
162
-
163
-
164
-
165
-
166
-
167
-
168
-
169
-
170
-
171
-
172
-
173
-
174
-
175
-
176
-
177
-
178
-
179
-
180
-
181
-
182
-
183
-
184
-
185
-
186
-
187
-
188
-
189
-
190
-
191
-
192
-
193
-
194
-
195
-
196
-
197
-
198
-
199
-
200
-
201
-
202
-
203
-
204
-
205
-
206
-
207
-
208
-
209
-
210
-
211
-
212
-
213
-
214
-
215
-
216
-
217
-
218
-
219
-
220
-
221
-
222
-
223
-
224
-
225
-
226
-
227
-
228
-
229
-
230
-
231
-
232
-
 233
233 -
 234
234 -
 235
235 -
 236
236 -
 237
237 -
 238
238 -
 239
239 -
 240
240 -
 241
241 -
 242
242 -
 243
243 -
 244
244 -
 245
245 -
 246
246 -
 247
247 -
 248
248 -
 249
249 -
 250
250 -
 251
251 -
 252
252 -
 253
253 -
254
-
255
-
256
-
257
-
258
-
259
-
260
-
261
-
262
-
263
-
264
-
265
-
266
-
267
-
268
-
269
-
270
-
271
-
272
-
273
-
274
-
275
-
276
-
277
-
278
-
279
-
280
-
281
-
282
-
283
-
284
-
285
-
286
-
287
-
288
-
289
-
290
-
291
-
292
-
293
-
294
-
295
-
296
-
297
-
298
-
299
-
300
-
301
-
302
-
303
-
304
-
305
-
306
-
307
-
308
-
309
-
310
-
311
-
312
-
313
-
314
-
315
-
316
-
317
-
318
-
319
-
320
 |
 |

221
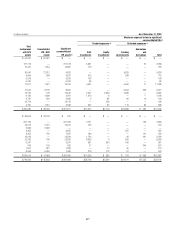
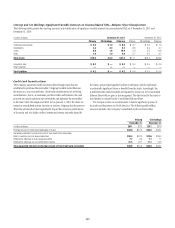
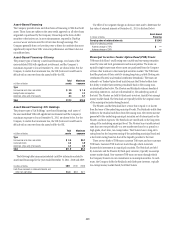
Credit Card Securitizations—Citicorp
The following table summarizes selected cash flow information related to
Citicorp’s credit card securitizations for the years ended December 31, 2011,
2010 and 2009:
In billions of dollars 2011
0ROCEEDSæFROMæNEWæSECURITIZATIONS $—
0AYæDOWNæOFæMATURINGæNOTES (12.8) .!
0ROCEEDSæFROMæCOLLECTIONSæREINVESTEDææ
INæNEWæRECEIVABLES N/A .!
#ONTRACTUALæSERVICINGæFEESæRECEIVED N/A .!
#ASHæFLOWSæRECEIVEDæONæRETAINEDææ
INTERESTSæANDæOTHERæNETæCASHæFLOWS N/A .!
Credit Card Securitizations—Citi Holdings
The following table summarizes selected cash flow information related to Citi
Holdings’ credit card securitizations for the years ended December 31, 2011,
2010 and 2009:
In billions of dollars 2011
0ROCEEDSæFROMæNEWæSECURITIZATIONS $ 3.9
0AYæDOWNæOFæMATURINGæNOTES (7.7) .!
0ROCEEDSæFROMæCOLLECTIONSæREINVESTEDææ
INæNEWæRECEIVABLES N/A .!
#ONTRACTUALæSERVICINGæFEESæRECEIVED N/A .!
#ASHæFLOWSæRECEIVEDæONæRETAINEDææ
INTERESTSæANDæOTHERæNETæCASHæFLOWS N/A .!
Managed Loans
After securitization of credit card receivables, the Company continues to
maintain credit card customer account relationships and provides servicing
for receivables transferred to the trusts. As a result, the Company considers
the securitized credit card receivables to be part of the business it manages.
As Citigroup consolidates the credit card trusts, all managed securitized card
receivables are on-balance sheet.
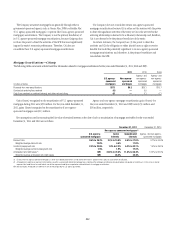
Funding, Liquidity Facilities and Subordinated Interests
Citigroup securitizes credit card receivables through two securitization
trusts—Citibank Credit Card Master Trust (Master Trust), which is part of
Citicorp, and the Citibank OMNI Master Trust (Omni Trust), which is part of
Citi Holdings as of December 31, 2011. The liabilities of the trusts are included
in the Consolidated Balance Sheet, excluding those retained by Citigroup.
Master Trust issues fixed- and floating-rate term notes. Some of the term
notes are issued to multi-seller commercial paper conduits. The weighted
average maturity of the term notes issued by the Master Trust was 3.1 years as
of December 31, 2011 and 3.4 years as of December 31, 2010.
Master Trust Liabilities (at par value)
In billions of dollars
December 31,
2011
$ECEMBERæææ
4ERMæNOTESæISSUEDæTOæMULTISELLERææ
COMMERCIALæPAPERæCONDUITS $—
4ERMæNOTESæISSUEDæTOæTHIRDæPARTIES 30.4
4ERMæNOTESæRETAINEDæBYæ#ITIGROUPæAFFILIATESæ 7.7
Total Master Trust liabilities $38.1
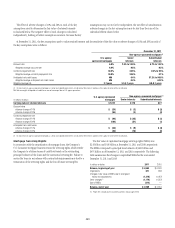
The Omni Trust issues fixed- and floating-rate term notes, some of which
are purchased by multi-seller commercial paper conduits.
The weighted average maturity of the third-party term notes issued by
the Omni Trust was 1.5 years as of December 31, 2011 and 1.8 years as of
December 31, 2010.
Omni Trust Liabilities (at par value)
In billions of dollars
December 31,
2011
$ECEMBERææ
4ERMæNOTESæISSUEDæTOæMULTISELLERææ
COMMERCIALæPAPERæCONDUITS $ 3.4
4ERMæNOTESæISSUEDæTOæTHIRDæPARTIES 9.2
4ERMæNOTESæRETAINEDæBYæ#ITIGROUPæAFFILIATESæ 7.1
Total Omni Trust liabilities $19.7
Mortgage Securitizations
The Company provides a wide range of mortgage loan products to a diverse
customer base.
Once originated, the Company often securitizes these loans through the
use of SPEs. These SPEs are funded through the issuance of Trust Certificates
backed solely by the transferred assets. These certificates have the same
average life as the transferred assets. In addition to providing a source of
liquidity and less expensive funding, securitizing these assets also reduces
the Company’s credit exposure to the borrowers. These mortgage loan
securitizations are primarily non-recourse, thereby effectively transferring
the risk of future credit losses to the purchasers of the securities issued by
the trust. However, the Company’s Consumer business generally retains
the servicing rights and in certain instances retains investment securities,
interest-only strips and residual interests in future cash flows from the trusts
and also provides servicing for a limited number of Securities and Banking
securitizations. Securities and Banking and Special Asset Pool do not retain
servicing for their mortgage securitizations.