Citibank 2011 Annual Report Download - page 31
Download and view the complete annual report
Please find page 31 of the 2011 Citibank annual report below. You can navigate through the pages in the report by either clicking on the pages listed below, or by using the keyword search tool below to find specific information within the annual report.-
 1
1 -
2
-
3
-
4
-
5
-
6
-
7
-
8
-
9
-
10
-
11
-
12
-
13
-
14
-
15
-
16
-
17
-
18
-
19
-
20
-
 21
21 -
 22
22 -
 23
23 -
 24
24 -
 25
25 -
 26
26 -
 27
27 -
 28
28 -
 29
29 -
 30
30 -
 31
31 -
 32
32 -
 33
33 -
 34
34 -
 35
35 -
 36
36 -
 37
37 -
 38
38 -
 39
39 -
 40
40 -
 41
41 -
42
-
43
-
44
-
45
-
46
-
47
-
48
-
49
-
50
-
51
-
52
-
53
-
54
-
55
-
56
-
57
-
58
-
59
-
60
-
61
-
62
-
63
-
64
-
65
-
66
-
67
-
68
-
69
-
70
-
71
-
72
-
73
-
74
-
75
-
76
-
77
-
78
-
79
-
80
-
81
-
82
-
83
-
84
-
85
-
86
-
87
-
88
-
89
-
90
-
91
-
92
-
93
-
94
-
95
-
96
-
97
-
98
-
99
-
100
-
101
-
102
-
103
-
104
-
105
-
106
-
107
-
108
-
109
-
110
-
111
-
112
-
113
-
114
-
115
-
116
-
117
-
118
-
119
-
120
-
121
-
122
-
123
-
124
-
125
-
126
-
127
-
128
-
129
-
130
-
131
-
132
-
133
-
134
-
135
-
136
-
137
-
138
-
139
-
140
-
141
-
142
-
143
-
144
-
145
-
146
-
147
-
148
-
149
-
150
-
151
-
152
-
153
-
154
-
155
-
156
-
157
-
158
-
159
-
160
-
161
-
162
-
163
-
164
-
165
-
166
-
167
-
168
-
169
-
170
-
171
-
172
-
173
-
174
-
175
-
176
-
177
-
178
-
179
-
180
-
181
-
182
-
183
-
184
-
185
-
186
-
187
-
188
-
189
-
190
-
191
-
192
-
193
-
194
-
195
-
196
-
197
-
198
-
199
-
200
-
201
-
202
-
203
-
204
-
205
-
206
-
207
-
208
-
209
-
210
-
211
-
212
-
213
-
214
-
215
-
216
-
217
-
218
-
219
-
220
-
221
-
222
-
223
-
224
-
225
-
226
-
227
-
228
-
229
-
230
-
231
-
232
-
233
-
234
-
235
-
236
-
237
-
238
-
239
-
240
-
241
-
242
-
243
-
244
-
245
-
246
-
247
-
248
-
249
-
250
-
251
-
252
-
253
-
254
-
255
-
256
-
257
-
258
-
259
-
260
-
261
-
262
-
263
-
264
-
265
-
266
-
267
-
268
-
269
-
270
-
271
-
272
-
273
-
274
-
275
-
276
-
277
-
278
-
279
-
280
-
281
-
282
-
283
-
284
-
285
-
286
-
287
-
288
-
289
-
290
-
291
-
292
-
293
-
294
-
295
-
296
-
297
-
298
-
299
-
300
-
301
-
302
-
303
-
304
-
305
-
306
-
307
-
308
-
309
-
310
-
311
-
312
-
313
-
314
-
315
-
316
-
317
-
318
-
319
-
320
 |
 |
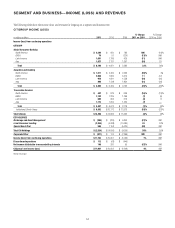
9
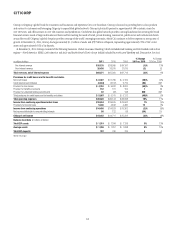
Citi Holdings
Citi Holdings’ net loss of $(2.6) billion in 2011 improved by $1.6 billion
as compared to the net loss in 2010. The improvement in 2011 reflected a
significant decline in credit costs and lower operating expenses, given the
continued decline in assets, partially offset by lower revenues.
While Citi Holdings’ impact on Citi has been declining, it will likely
continue to present a headwind for Citi’s overall performance due to, among
other factors, the lower percentage of interest-earning assets remaining
in Citi Holdings, the slower pace of asset reductions and the transfer of
the substantial majority of retail partner cards out of Citi Holdings into
Citicorp—North America Regional Consumer Banking in the first quarter
of 2012. During the first quarter of 2012, Citi will republish its historical
segment reporting for Citicorp and Citi Holdings to reflect this transfer in
prior periods. The adjusted net loss in Citi Holdings for these historical
periods will be higher than previously reported, as the retail partner cards
business in Local Consumer Lending was the primary source of profitability
in Citi Holdings.
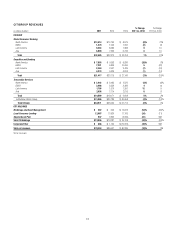
Citi Holdings’ revenues declined 33% to $12.9 billion from the prior year.
Net interest revenues decreased by $4.5 billion, or 30%, to $10.3 billion,
primarily due to the decline in assets, including lower interest-earning assets
in the Special Asset Pool. Non-interest revenues declined by $1.9 billion, or
42%, to $2.6 billion in 2011, driven by lower gains on asset sales and other
revenue marks as compared to 2010, as well as divestitures.
Citi Holdings’ assets declined $90 billion, or 25%, to $269 billion at
the end of 2011, although Citi believes the pace of asset wind-down in Citi
Holdings will decrease going forward. The decline during 2011 reflected
nearly $49 billion in asset sales and business dispositions, $35 billion in
net run-off and amortization and approximately $6 billion in net cost of
credit and net asset marks. As of December 31, 2011, Local Consumer
Lending continued to represent the largest segment within Citi Holdings,
with $201 billion of assets. Over half of Local Consumer Lending assets,
or approximately $109 billion, were related to North America real estate
lending. As of December 31, 2011, there were approximately $10 billion
of loan loss reserves allocated to North America real estate lending in Citi
Holdings, representing roughly 31 months of coincident net credit loss
coverage.
At the end of 2011, Citi Holdings assets comprised approximately 14%
of total Citigroup GAAP assets and 25% of its risk-weighted assets. The first
quarter of 2012 transfer of the substantial majority of the retail partner cards
business (approximately $45 billion of assets, including approximately
$41 billion of loans) will result in Citi Holdings comprising approximately
12% of total Citigroup GAAP assets and 21% of risk-weighted assets.