Citibank 2011 Annual Report Download - page 49
Download and view the complete annual report
Please find page 49 of the 2011 Citibank annual report below. You can navigate through the pages in the report by either clicking on the pages listed below, or by using the keyword search tool below to find specific information within the annual report.-
 1
1 -
2
-
3
-
4
-
5
-
6
-
7
-
8
-
9
-
10
-
11
-
12
-
13
-
14
-
15
-
16
-
17
-
18
-
19
-
20
-
21
-
22
-
23
-
24
-
25
-
26
-
27
-
28
-
29
-
30
-
31
-
32
-
33
-
34
-
35
-
36
-
37
-
38
-
 39
39 -
 40
40 -
 41
41 -
 42
42 -
 43
43 -
 44
44 -
 45
45 -
 46
46 -
 47
47 -
 48
48 -
 49
49 -
 50
50 -
 51
51 -
 52
52 -
 53
53 -
 54
54 -
 55
55 -
 56
56 -
 57
57 -
 58
58 -
 59
59 -
60
-
61
-
62
-
63
-
64
-
65
-
66
-
67
-
68
-
69
-
70
-
71
-
72
-
73
-
74
-
75
-
76
-
77
-
78
-
79
-
80
-
81
-
82
-
83
-
84
-
85
-
86
-
87
-
88
-
89
-
90
-
91
-
92
-
93
-
94
-
95
-
96
-
97
-
98
-
99
-
100
-
101
-
102
-
103
-
104
-
105
-
106
-
107
-
108
-
109
-
110
-
111
-
112
-
113
-
114
-
115
-
116
-
117
-
118
-
119
-
120
-
121
-
122
-
123
-
124
-
125
-
126
-
127
-
128
-
129
-
130
-
131
-
132
-
133
-
134
-
135
-
136
-
137
-
138
-
139
-
140
-
141
-
142
-
143
-
144
-
145
-
146
-
147
-
148
-
149
-
150
-
151
-
152
-
153
-
154
-
155
-
156
-
157
-
158
-
159
-
160
-
161
-
162
-
163
-
164
-
165
-
166
-
167
-
168
-
169
-
170
-
171
-
172
-
173
-
174
-
175
-
176
-
177
-
178
-
179
-
180
-
181
-
182
-
183
-
184
-
185
-
186
-
187
-
188
-
189
-
190
-
191
-
192
-
193
-
194
-
195
-
196
-
197
-
198
-
199
-
200
-
201
-
202
-
203
-
204
-
205
-
206
-
207
-
208
-
209
-
210
-
211
-
212
-
213
-
214
-
215
-
216
-
217
-
218
-
219
-
220
-
221
-
222
-
223
-
224
-
225
-
226
-
227
-
228
-
229
-
230
-
231
-
232
-
233
-
234
-
235
-
236
-
237
-
238
-
239
-
240
-
241
-
242
-
243
-
244
-
245
-
246
-
247
-
248
-
249
-
250
-
251
-
252
-
253
-
254
-
255
-
256
-
257
-
258
-
259
-
260
-
261
-
262
-
263
-
264
-
265
-
266
-
267
-
268
-
269
-
270
-
271
-
272
-
273
-
274
-
275
-
276
-
277
-
278
-
279
-
280
-
281
-
282
-
283
-
284
-
285
-
286
-
287
-
288
-
289
-
290
-
291
-
292
-
293
-
294
-
295
-
296
-
297
-
298
-
299
-
300
-
301
-
302
-
303
-
304
-
305
-
306
-
307
-
308
-
309
-
310
-
311
-
312
-
313
-
314
-
315
-
316
-
317
-
318
-
319
-
320
 |
 |

27
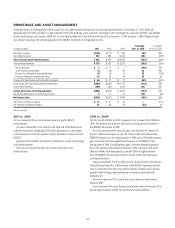
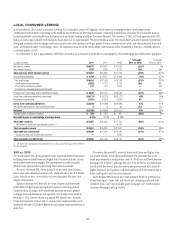
2011 vs. 2010
S&B’s results of operations for 2011 were significantly impacted by the
macroeconomic concerns during the year, including the overall pace of U.S.
economic recovery, the U.S. debt ceiling debate and subsequent downgrade of
U.S. sovereign credit, the ongoing sovereign debt crisis in Europe and general
continued concerns about the health of the global economy and financial
markets. These concerns led to heightened volatility as well as overall
declines in liquidity and market activity during the second half of the year as
clients reduced their activity and risk.
Net income of $4.9 billion decreased 24%. Excluding CVA/DVA (see table
below), net income decreased 43% as declines in fixed income and equity
markets revenues and investment banking revenues, along with higher
expenses, more than offset increases in lending and private bank revenues.
Revenues of $21.4 billion decreased 7% from the prior year. CVA/DVA
increased by $2.1 billion from the prior year, driven by the widening of Citi’s
credit spreads in 2011. Excluding CVA/DVA, S&B revenues decreased 16%,
reflecting lower results in fixed income markets, equity markets and investment
banking, partially offset by increased revenues in lending and the private bank.
Fixed income markets revenues, which constituted over 50% of S&B
revenues in 2011, decreased 24% excluding CVA/DVA. This was driven by
lower results in securitized and credit products, reflecting the challenging
market environment and reduced customer risk appetite and, to a lesser
extent, rates and currencies.
Equity markets revenues decreased 35% excluding CVA/DVA, driven by
declining revenues in equity proprietary trading (which Citi also refers to as
equity principal strategies) as positions in the business were wound down,
a decline in equity derivatives revenues and, to a lesser extent, a decline in
cash equities. The wind down of Citi’s equity proprietary trading was
completed at the end of 2011.
Investment banking revenues declined 14%, as the macroeconomic
concerns and market uncertainty drove lower volumes in debt and equity
issuance.
Lending revenues increased 87%, mainly due to the absence of losses on
credit default swap hedges in the prior year (see the table below). Excluding
the impact of these hedging gains and losses, lending revenues increased
3%, primarily due to growth in the Corporate loan portfolio. Private bank
revenues increased 6% excluding CVA/DVA, primarily due to higher loan and
deposit balances and improved customer pricing, partially offset by declines
in investment and capital markets-related products given the negative
market sentiment.
Expenses increased 2%, primarily due to investment spending, which
largely occurred in the first half of the year, relating to new hires and
technology investments. The increase in expenses was also driven by higher
repositioning charges and the negative impact of FX translation (which
contributed approximately 2% to the expense growth), partially offset by
productivity saves and reduced incentive compensation due to business
results. The increase in the level of investment spending in S&B was largely
completed at the end of 2011.
Provisions increased by $140 million, primarily due to builds in the
allowance for unfunded lending commitments as a result of portfolio growth
and higher net credit losses.
2010 vs. 2009
Net income of $6.4 billion decreased 30%. Excluding CVA/DVA, net income
decreased 36%, as an increase in lending was more than offset by declines
in fixed income and equity trading activities, investment banking fees and
higher expenses.
Revenues of $23.1 billion decreased 15% from the prior year, as
performance in the first half of 2009 was particularly strong due to higher
fixed income markets activity and client activity levels in investment
banking. In addition, 2010 CVA/DVA increased $1.6 billion from the prior
year, mainly due to a larger narrowing of Citi’s spreads in 2009 compared
2010. Excluding CVA/DVA, revenues decreased 19%, reflecting lower results
in fixed income markets, equity markets and investment banking, partially
offset by increased revenues in lending.
Fixed income markets revenues decreased 32% excluding CVA/DVA, primarily
reflecting lower results in rates and currencies, credit products and securitized
products due to the overall weaker market environment during 2010.
Equity markets revenues decreased 31% excluding CVA/DVA, driven
by lower trading revenues linked to the derivatives business and equity
proprietary trading.
Investment banking revenues declined 20%, reflecting lower levels of
market activity in debt and equity underwriting.
Lending revenues increased by $3.4 billion, mainly driven by a reduction
in losses on credit default swap hedges.
Expenses increased 12%, or $1.6 billion, year over year. Excluding the
2010 U.K. bonus tax impact and litigation reserve releases in the first half
of 2010 and 2009, expenses increased 8%, or $1.1 billion, mainly as a result
of higher compensation, transaction costs and the negative impact of FX
translation (which contributed approximately 1% to the expense growth).
Provisions decreased by $1.8 billion, to negative $24 million, mainly
due to credit reserve releases and lower net credit losses as the result of an
improvement in the credit environment during 2010.
In millions of dollars 2011
S&B CVA/DVA
&IXEDæ)NCOMEæ-ARKETS $1,368
%QUITYæ-ARKETS 355
0RIVATEæ"ANK 9
Total S&B CVA/DVA $1,732
Total S&B Lending Hedge gain (loss) $ 73