Citibank 2011 Annual Report Download - page 115
Download and view the complete annual report
Please find page 115 of the 2011 Citibank annual report below. You can navigate through the pages in the report by either clicking on the pages listed below, or by using the keyword search tool below to find specific information within the annual report.-
 1
1 -
2
-
3
-
4
-
5
-
6
-
7
-
8
-
9
-
10
-
11
-
12
-
13
-
14
-
15
-
16
-
17
-
18
-
19
-
20
-
21
-
22
-
23
-
24
-
25
-
26
-
27
-
28
-
29
-
30
-
31
-
32
-
33
-
34
-
35
-
36
-
37
-
38
-
39
-
40
-
41
-
42
-
43
-
44
-
45
-
46
-
47
-
48
-
49
-
50
-
51
-
52
-
53
-
54
-
55
-
56
-
57
-
58
-
59
-
60
-
61
-
62
-
63
-
64
-
65
-
66
-
67
-
68
-
69
-
70
-
71
-
72
-
73
-
74
-
75
-
76
-
77
-
78
-
79
-
80
-
81
-
82
-
83
-
84
-
85
-
86
-
87
-
88
-
89
-
90
-
91
-
92
-
93
-
94
-
95
-
96
-
97
-
98
-
99
-
100
-
101
-
102
-
103
-
104
-
 105
105 -
 106
106 -
 107
107 -
 108
108 -
 109
109 -
 110
110 -
 111
111 -
 112
112 -
 113
113 -
 114
114 -
 115
115 -
 116
116 -
 117
117 -
 118
118 -
 119
119 -
 120
120 -
 121
121 -
 122
122 -
 123
123 -
 124
124 -
 125
125 -
126
-
127
-
128
-
129
-
130
-
131
-
132
-
133
-
134
-
135
-
136
-
137
-
138
-
139
-
140
-
141
-
142
-
143
-
144
-
145
-
146
-
147
-
148
-
149
-
150
-
151
-
152
-
153
-
154
-
155
-
156
-
157
-
158
-
159
-
160
-
161
-
162
-
163
-
164
-
165
-
166
-
167
-
168
-
169
-
170
-
171
-
172
-
173
-
174
-
175
-
176
-
177
-
178
-
179
-
180
-
181
-
182
-
183
-
184
-
185
-
186
-
187
-
188
-
189
-
190
-
191
-
192
-
193
-
194
-
195
-
196
-
197
-
198
-
199
-
200
-
201
-
202
-
203
-
204
-
205
-
206
-
207
-
208
-
209
-
210
-
211
-
212
-
213
-
214
-
215
-
216
-
217
-
218
-
219
-
220
-
221
-
222
-
223
-
224
-
225
-
226
-
227
-
228
-
229
-
230
-
231
-
232
-
233
-
234
-
235
-
236
-
237
-
238
-
239
-
240
-
241
-
242
-
243
-
244
-
245
-
246
-
247
-
248
-
249
-
250
-
251
-
252
-
253
-
254
-
255
-
256
-
257
-
258
-
259
-
260
-
261
-
262
-
263
-
264
-
265
-
266
-
267
-
268
-
269
-
270
-
271
-
272
-
273
-
274
-
275
-
276
-
277
-
278
-
279
-
280
-
281
-
282
-
283
-
284
-
285
-
286
-
287
-
288
-
289
-
290
-
291
-
292
-
293
-
294
-
295
-
296
-
297
-
298
-
299
-
300
-
301
-
302
-
303
-
304
-
305
-
306
-
307
-
308
-
309
-
310
-
311
-
312
-
313
-
314
-
315
-
316
-
317
-
318
-
319
-
320
 |
 |

93
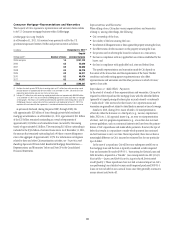
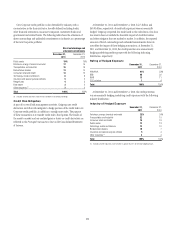
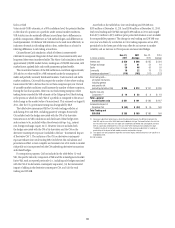
Citi’s Corporate credit portfolio is also diversified by industry, with a
concentration in the financial sector, broadly defined, including banks,
other financial institutions, insurance companies, investment banks and
government and central banks. The following table shows the allocation of
direct outstandings and unfunded commitments to industries as a percentage
of the total Corporate portfolio:
Direct outstandings and
unfunded commitments
December 31,
2011
$ECEMBERææ
0UBLICæSECTOR 19%
0ETROLEUMæENERGYæCHEMICALæANDæMETAL 17
4RANSPORTATIONæANDæINDUSTRIAL 16
"ANKSBROKERDEALERS 13
#ONSUMERæRETAILæANDæHEALTH 13
4ECHNOLOGYæMEDIAæANDæTELECOM 8
)NSURANCEæANDæSPECIALæPURPOSEæVEHICLES 5
(EDGEæFUNDS 4
2EALæESTATE 3
/THERæINDUSTRIESæ 2
Total 100%
æ )NCLUDESæALLæOTHERæINDUSTRIESæNONEæOFæWHICHæEXCEEDSææOFæTOTALæOUTSTANDINGS
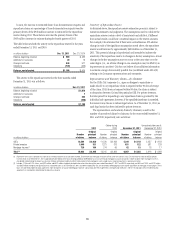
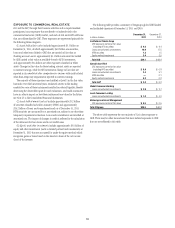
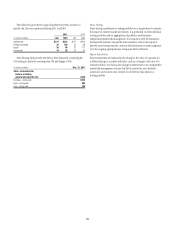
Credit Risk Mitigation
As part of its overall risk management activities, Citigroup uses credit
derivatives and other risk mitigants to hedge portions of the credit risk in its
Corporate credit portfolio, in addition to outright asset sales. The purpose
of these transactions is to transfer credit risk to third parties. The results of
the mark to market and any realized gains or losses on credit derivatives are
reflected in the Principal transactions line on the Consolidated Statement
of Income.
At December 31, 2011 and December 31, 2010, $41.5 billion and
$49.0 billion, respectively, of credit risk exposures were economically
hedged. Citigroup’s expected loss model used in the calculation of its loan
loss reserve does not include the favorable impact of credit derivatives
and other mitigants that are marked to market. In addition, the reported
amounts of direct outstandings and unfunded commitments above do
not reflect the impact of these hedging transactions. At December 31,
2011 and December 31, 2010, the credit protection was economically
hedging underlying credit exposure with the following risk rating
distribution, respectively:
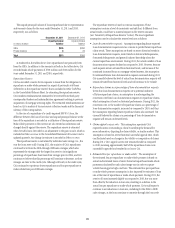
Rating of Hedged Exposure
December 31,
2011
$ECEMBERææ
!!!!!! 41%
""" 45
""" 13
###æORæBELOW 1
Total 100%
At December 31, 2011 and December 31, 2010, the credit protection
was economically hedging underlying credit exposures with the following
industry distribution:
Industry of Hedged Exposure
December 31,
2011
$ECEMBERææ
0ETROLEUMæENERGYæCHEMICALæANDæMETALæ 22%
4RANSPORTATIONæANDæINDUSTRIAL 22
#ONSUMERæRETAILæANDæHEALTH 15
0UBLICæSECTOR 12
4ECHNOLOGYæMEDIAæANDæTELECOM 12
"ANKSBROKERDEALERS 10
)NSURANCEæANDæSPECIALæPURPOSEæVEHICLES 5
/THERæINDUSTRIESæ 2
Total 100%
æ )NCLUDESæALLæOTHERæINDUSTRIESæNONEæOFæWHICHæISæGREATERæTHANææOFæTHEæTOTALæHEDGEDæAMOUNT