Citibank 2011 Annual Report Download - page 231
Download and view the complete annual report
Please find page 231 of the 2011 Citibank annual report below. You can navigate through the pages in the report by either clicking on the pages listed below, or by using the keyword search tool below to find specific information within the annual report.-
 1
1 -
2
-
3
-
4
-
5
-
6
-
7
-
8
-
9
-
10
-
11
-
12
-
13
-
14
-
15
-
16
-
17
-
18
-
19
-
20
-
21
-
22
-
23
-
24
-
25
-
26
-
27
-
28
-
29
-
30
-
31
-
32
-
33
-
34
-
35
-
36
-
37
-
38
-
39
-
40
-
41
-
42
-
43
-
44
-
45
-
46
-
47
-
48
-
49
-
50
-
51
-
52
-
53
-
54
-
55
-
56
-
57
-
58
-
59
-
60
-
61
-
62
-
63
-
64
-
65
-
66
-
67
-
68
-
69
-
70
-
71
-
72
-
73
-
74
-
75
-
76
-
77
-
78
-
79
-
80
-
81
-
82
-
83
-
84
-
85
-
86
-
87
-
88
-
89
-
90
-
91
-
92
-
93
-
94
-
95
-
96
-
97
-
98
-
99
-
100
-
101
-
102
-
103
-
104
-
105
-
106
-
107
-
108
-
109
-
110
-
111
-
112
-
113
-
114
-
115
-
116
-
117
-
118
-
119
-
120
-
121
-
122
-
123
-
124
-
125
-
126
-
127
-
128
-
129
-
130
-
131
-
132
-
133
-
134
-
135
-
136
-
137
-
138
-
139
-
140
-
141
-
142
-
143
-
144
-
145
-
146
-
147
-
148
-
149
-
150
-
151
-
152
-
153
-
154
-
155
-
156
-
157
-
158
-
159
-
160
-
161
-
162
-
163
-
164
-
165
-
166
-
167
-
168
-
169
-
170
-
171
-
172
-
173
-
174
-
175
-
176
-
177
-
178
-
179
-
180
-
181
-
182
-
183
-
184
-
185
-
186
-
187
-
188
-
189
-
190
-
191
-
192
-
193
-
194
-
195
-
196
-
197
-
198
-
199
-
200
-
201
-
202
-
203
-
204
-
205
-
206
-
207
-
208
-
209
-
210
-
211
-
212
-
213
-
214
-
215
-
216
-
217
-
218
-
219
-
220
-
 221
221 -
 222
222 -
 223
223 -
 224
224 -
 225
225 -
 226
226 -
 227
227 -
 228
228 -
 229
229 -
 230
230 -
 231
231 -
 232
232 -
 233
233 -
 234
234 -
 235
235 -
 236
236 -
 237
237 -
 238
238 -
 239
239 -
 240
240 -
 241
241 -
242
-
243
-
244
-
245
-
246
-
247
-
248
-
249
-
250
-
251
-
252
-
253
-
254
-
255
-
256
-
257
-
258
-
259
-
260
-
261
-
262
-
263
-
264
-
265
-
266
-
267
-
268
-
269
-
270
-
271
-
272
-
273
-
274
-
275
-
276
-
277
-
278
-
279
-
280
-
281
-
282
-
283
-
284
-
285
-
286
-
287
-
288
-
289
-
290
-
291
-
292
-
293
-
294
-
295
-
296
-
297
-
298
-
299
-
300
-
301
-
302
-
303
-
304
-
305
-
306
-
307
-
308
-
309
-
310
-
311
-
312
-
313
-
314
-
315
-
316
-
317
-
318
-
319
-
320
 |
 |

209
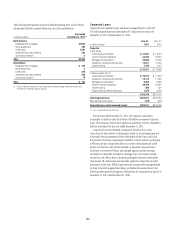
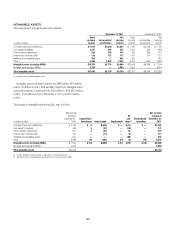
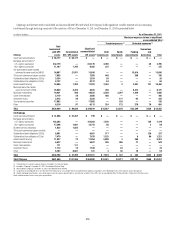
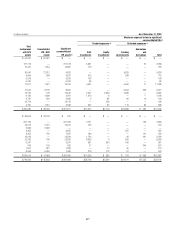
INTANGIBLE ASSETS
The components of intangible assets were as follows:
December 31, 2011 $ECEMBERææ
In millions of dollars
Gross
carrying
amount
Accumulated
amortization
Net
carrying
amount
'ROSSæ
CARRYINGæ
AMOUNT
!CCUMULATEDæ
AMORTIZATION
.ETæ
CARRYINGæ
AMOUNT
0URCHASEDæCREDITæCARDæRELATIONSHIPS $ 7,616 $ 5,309 $ 2,307
#OREæDEPOSITæINTANGIBLES 1,337 965 372
/THERæCUSTOMERæRELATIONSHIPS 830 356 474
0RESENTæVALUEæOFæFUTUREæPROFITS 235 123 112
)NDEFINITELIVEDæINTANGIBLEæASSETS 492 — 492
/THERæ 4,866 2,023 2,843
Intangible assets (excluding MSRs) $15,376 $ 8,776 $ 6,600
-ORTGAGEæSERVICINGæRIGHTSæ-32S 2,569 — 2,569
Total intangible assets $17,945 $ 8,776 $ 9,169
æ )NCLUDESæCONTRACTRELATEDæINTANGIBLEæASSETS
Intangible assets amortization expense was $898 million, $976 million
and $1,179 million for 2011, 2010 and 2009, respectively. Intangible assets
amortization expense is estimated to be $826 million in 2012, $822 million
in 2013, $734 million in 2014, $700 million in 2015, and $807 million
in 2016.
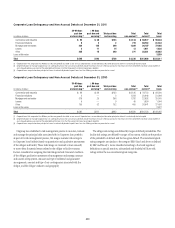
The changes in intangible assets during 2011 were as follows:
In millions of dollars
.ETæCARRYINGæ
AMOUNTæATæ
$ECEMBERææ
Acquisitions/
divestitures Amortization Impairments
FX
and
other (1)
Discontinued
operations
Net carrying
amount at
December 31,
2011
0URCHASEDæCREDITæCARDæRELATIONSHIPS $ 5 $(435) $ — $ (11) $ — $ 2,307
#OREæDEPOSITæINTANGIBLES 4 (97) — (18) — 372
/THERæCUSTOMERæRELATIONSHIPS 3 (51) — 15 — 474
0RESENTæVALUEæOFæFUTUREæPROFITS — (13) — (2) — 112
)NDEFINITELIVEDæINTANGIBLEæASSETS — — — (58) — 492
/THER 93 (302) (17) (2) (18) 2,843
Intangible assets (excluding MSRs) $ 105 $(898) $ (17) $ (76) $ (18) $ 6,600
-ORTGAGEæSERVICINGæRIGHTSæ-32Sæ 2,569
Total intangible assets $ 9,169
æ )NCLUDESæFOREIGNæEXCHANGEæTRANSLATIONæANDæPURCHASEæACCOUNTINGæADJUSTMENTS
æ 3EEæ.OTEææTOæTHEæ#ONSOLIDATEDæ&INANCIALæ3TATEMENTSæFORæTHEæROLLFORWARDæOFæ-32S