Citibank 2011 Annual Report Download - page 198
Download and view the complete annual report
Please find page 198 of the 2011 Citibank annual report below. You can navigate through the pages in the report by either clicking on the pages listed below, or by using the keyword search tool below to find specific information within the annual report.-
 1
1 -
2
-
3
-
4
-
5
-
6
-
7
-
8
-
9
-
10
-
11
-
12
-
13
-
14
-
15
-
16
-
17
-
18
-
19
-
20
-
21
-
22
-
23
-
24
-
25
-
26
-
27
-
28
-
29
-
30
-
31
-
32
-
33
-
34
-
35
-
36
-
37
-
38
-
39
-
40
-
41
-
42
-
43
-
44
-
45
-
46
-
47
-
48
-
49
-
50
-
51
-
52
-
53
-
54
-
55
-
56
-
57
-
58
-
59
-
60
-
61
-
62
-
63
-
64
-
65
-
66
-
67
-
68
-
69
-
70
-
71
-
72
-
73
-
74
-
75
-
76
-
77
-
78
-
79
-
80
-
81
-
82
-
83
-
84
-
85
-
86
-
87
-
88
-
89
-
90
-
91
-
92
-
93
-
94
-
95
-
96
-
97
-
98
-
99
-
100
-
101
-
102
-
103
-
104
-
105
-
106
-
107
-
108
-
109
-
110
-
111
-
112
-
113
-
114
-
115
-
116
-
117
-
118
-
119
-
120
-
121
-
122
-
123
-
124
-
125
-
126
-
127
-
128
-
129
-
130
-
131
-
132
-
133
-
134
-
135
-
136
-
137
-
138
-
139
-
140
-
141
-
142
-
143
-
144
-
145
-
146
-
147
-
148
-
149
-
150
-
151
-
152
-
153
-
154
-
155
-
156
-
157
-
158
-
159
-
160
-
161
-
162
-
163
-
164
-
165
-
166
-
167
-
168
-
169
-
170
-
171
-
172
-
173
-
174
-
175
-
176
-
177
-
178
-
179
-
180
-
181
-
182
-
183
-
184
-
185
-
186
-
187
-
 188
188 -
 189
189 -
 190
190 -
 191
191 -
 192
192 -
 193
193 -
 194
194 -
 195
195 -
 196
196 -
 197
197 -
 198
198 -
 199
199 -
 200
200 -
 201
201 -
 202
202 -
 203
203 -
 204
204 -
 205
205 -
 206
206 -
 207
207 -
 208
208 -
209
-
210
-
211
-
212
-
213
-
214
-
215
-
216
-
217
-
218
-
219
-
220
-
221
-
222
-
223
-
224
-
225
-
226
-
227
-
228
-
229
-
230
-
231
-
232
-
233
-
234
-
235
-
236
-
237
-
238
-
239
-
240
-
241
-
242
-
243
-
244
-
245
-
246
-
247
-
248
-
249
-
250
-
251
-
252
-
253
-
254
-
255
-
256
-
257
-
258
-
259
-
260
-
261
-
262
-
263
-
264
-
265
-
266
-
267
-
268
-
269
-
270
-
271
-
272
-
273
-
274
-
275
-
276
-
277
-
278
-
279
-
280
-
281
-
282
-
283
-
284
-
285
-
286
-
287
-
288
-
289
-
290
-
291
-
292
-
293
-
294
-
295
-
296
-
297
-
298
-
299
-
300
-
301
-
302
-
303
-
304
-
305
-
306
-
307
-
308
-
309
-
310
-
311
-
312
-
313
-
314
-
315
-
316
-
317
-
318
-
319
-
320
 |
 |

176
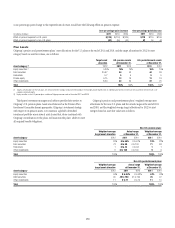
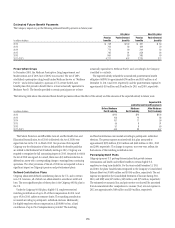
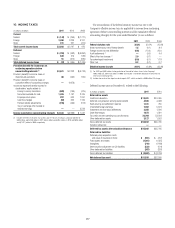
Estimated Future Benefit Payments
The Company expects to pay the following estimated benefit payments in future years:
U.S. plans Non-U.S. plans
In millions of dollars
Pension
benefits
Postretirement
benefits
Pension
benefits
Postretirement
benefits
æ
n
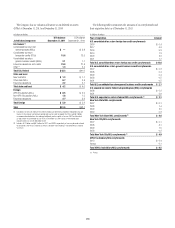
actuarially equivalent to Medicare Part D and, accordingly, the Company
is entitled to a subsidy.
The expected subsidy reduced the accumulated postretirement benefit
obligation (APBO) by approximately $96 million and $139 million as of
December 31, 2011 and 2010, respectively, and the postretirement expense by
approximately $10 million and $9 million for 2011 and 2010, respectively.
The following table shows the estimated future benefit payments without the effect of the subsidy and the amounts of the expected subsidy in future years:
Expected U.S.
postretirement benefit payments
In millions of dollars
Before Medicare
Part D subsidy
Medicare
Part D subsidy
After Medicare
Part D subsidy
æ æ
n
and fixed contributions are invested according to participants’ individual
elections. The pretax expense associated with this plan amounted to
approximately $383 million, $301 million and $442 million in 2011, 2010
and 2009, respectively. The change in expense, year-over-year, reflects the
fluctuations of the matching contribution rate.
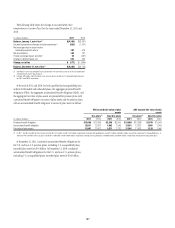
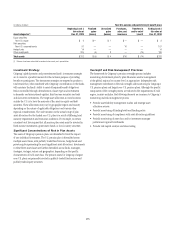
Postemployment Plans
Citigroup sponsors U.S. postemployment plans that provide income
continuation and health and welfare benefits to certain eligible U.S.
employees on long term disability. For the years ended December 31, 2011
and 2010, the plans’ funded status recognized in the Company’s Consolidated
Balance Sheet was $(469) million and $(436) million, respectively. The net
expense recognized in the Consolidated Statement of Income during 2011,
2010, and 2009 were $67 million, $69 million, and $57 million, respectively.
The estimated net actuarial loss and prior service cost that will be amortized
from Accumulated other comprehensive income (loss) into net expense in
2012 are approximately $169 million and $19 million, respectively.
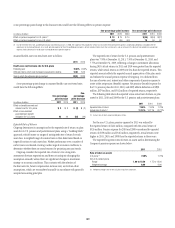
Prescription Drugs
In December 2003, the Medicare Prescription Drug Improvement and
Modernization Act of 2003 (Act of 2003) was enacted. The Act of 2003
established a prescription drug benefit under Medicare known as “Medicare
Part D,” and a federal subsidy to sponsors of U.S. retiree health-care
benefit plans that provide a benefit that is at least actuarially equivalent to
Medicare Part D. The benefits provided to certain participants are at least
The Patient Protection and Affordable Care Act and the Health Care and
Education Reconciliation Act of 2010 (collectively, the Act of 2010) were
signed into law in the U.S. in March 2010. One provision that impacted
Citigroup was the elimination of the tax deductibility for benefits paid that
are related to the Medicare Part D subsidy, starting in 2013. Citigroup was
required to recognize the full accounting impact in 2010, the period in which
the Act of 2010 was signed. As a result, there was a $45 million reduction in
deferred tax assets with a corresponding charge to earnings from continuing
operations. The other provisions of the Act of 2010 are not expected to have a
significant impact on Citigroup’s pension and postretirement plans.
Defined Contribution Plans
Citigroup administers defined contribution plans in the U.S. and in certain
non-U.S. locations, all of which are administered in accordance with local
laws. The most significant plan of these plans is the Citigroup 401(k) plan in
the U.S.
Under the Citigroup 401(k) plan, eligible U.S. employees received
matching contributions of up to 6% of their compensation for 2011 and
up to 4% for 2010, subject to statutory limits. The matching contribution
is invested according to participants’ individual elections. Additionally,
for eligible employees whose compensation is $100,000 or less, a fixed
contribution of up to 2% of compensation is provided. The matching