Citibank 2011 Annual Report Download - page 114
Download and view the complete annual report
Please find page 114 of the 2011 Citibank annual report below. You can navigate through the pages in the report by either clicking on the pages listed below, or by using the keyword search tool below to find specific information within the annual report.-
 1
1 -
2
-
3
-
4
-
5
-
6
-
7
-
8
-
9
-
10
-
11
-
12
-
13
-
14
-
15
-
16
-
17
-
18
-
19
-
20
-
21
-
22
-
23
-
24
-
25
-
26
-
27
-
28
-
29
-
30
-
31
-
32
-
33
-
34
-
35
-
36
-
37
-
38
-
39
-
40
-
41
-
42
-
43
-
44
-
45
-
46
-
47
-
48
-
49
-
50
-
51
-
52
-
53
-
54
-
55
-
56
-
57
-
58
-
59
-
60
-
61
-
62
-
63
-
64
-
65
-
66
-
67
-
68
-
69
-
70
-
71
-
72
-
73
-
74
-
75
-
76
-
77
-
78
-
79
-
80
-
81
-
82
-
83
-
84
-
85
-
86
-
87
-
88
-
89
-
90
-
91
-
92
-
93
-
94
-
95
-
96
-
97
-
98
-
99
-
100
-
101
-
102
-
103
-
 104
104 -
 105
105 -
 106
106 -
 107
107 -
 108
108 -
 109
109 -
 110
110 -
 111
111 -
 112
112 -
 113
113 -
 114
114 -
 115
115 -
 116
116 -
 117
117 -
 118
118 -
 119
119 -
 120
120 -
 121
121 -
 122
122 -
 123
123 -
 124
124 -
125
-
126
-
127
-
128
-
129
-
130
-
131
-
132
-
133
-
134
-
135
-
136
-
137
-
138
-
139
-
140
-
141
-
142
-
143
-
144
-
145
-
146
-
147
-
148
-
149
-
150
-
151
-
152
-
153
-
154
-
155
-
156
-
157
-
158
-
159
-
160
-
161
-
162
-
163
-
164
-
165
-
166
-
167
-
168
-
169
-
170
-
171
-
172
-
173
-
174
-
175
-
176
-
177
-
178
-
179
-
180
-
181
-
182
-
183
-
184
-
185
-
186
-
187
-
188
-
189
-
190
-
191
-
192
-
193
-
194
-
195
-
196
-
197
-
198
-
199
-
200
-
201
-
202
-
203
-
204
-
205
-
206
-
207
-
208
-
209
-
210
-
211
-
212
-
213
-
214
-
215
-
216
-
217
-
218
-
219
-
220
-
221
-
222
-
223
-
224
-
225
-
226
-
227
-
228
-
229
-
230
-
231
-
232
-
233
-
234
-
235
-
236
-
237
-
238
-
239
-
240
-
241
-
242
-
243
-
244
-
245
-
246
-
247
-
248
-
249
-
250
-
251
-
252
-
253
-
254
-
255
-
256
-
257
-
258
-
259
-
260
-
261
-
262
-
263
-
264
-
265
-
266
-
267
-
268
-
269
-
270
-
271
-
272
-
273
-
274
-
275
-
276
-
277
-
278
-
279
-
280
-
281
-
282
-
283
-
284
-
285
-
286
-
287
-
288
-
289
-
290
-
291
-
292
-
293
-
294
-
295
-
296
-
297
-
298
-
299
-
300
-
301
-
302
-
303
-
304
-
305
-
306
-
307
-
308
-
309
-
310
-
311
-
312
-
313
-
314
-
315
-
316
-
317
-
318
-
319
-
320
 |
 |

92
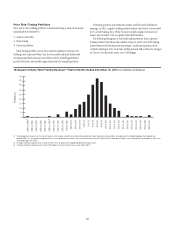
CORPORATE LOAN DETAILS
For corporate clients and investment banking activities across Citigroup, the
credit process is grounded in a series of fundamental policies, in addition
to those described under “Managing Global Risk—Risk Management—
Overview,” above. These include:
joint business and independent risk management responsibility for
managing credit risks;
a single center of control for each credit relationship that coordinates
credit activities with that client;
portfolio limits to ensure diversification and maintain risk/capital
alignment;
a minimum of two authorized credit officer signatures required on
extensions of credit, one of which must be from a credit officer in credit
risk management;
risk rating standards, applicable to every obligor and facility; and
consistent standards for credit origination documentation and remedial
management.
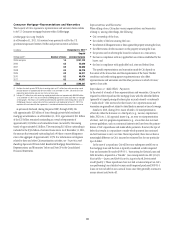
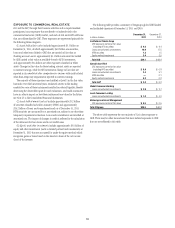
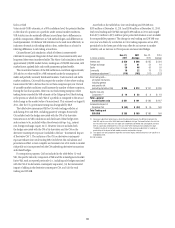
Corporate Credit Portfolio
The following table represents the Corporate credit portfolio (excluding
private banking), before consideration of collateral, by maturity at
December 31, 2011. The Corporate portfolio is broken out by direct
outstandings, which include drawn loans, overdrafts, interbank placements,
bankers’ acceptances and leases, and unfunded commitments, which include
unused commitments to lend, letters of credit and financial guarantees.
At December 31, 2011 !Tæ$ECEMBERææ
In billions of dollars
Due
within
1 year
Greater
than 1 year
but within
5 years
Greater
than
5 years
Total
exposure
$UEæ
WITHINæ
æYEAR
'REATERæ
THANææYEARæ
BUTæWITHINæ
æYEARS
'REATERæ
THANæ
æYEARS
4OTALæ
EXPOSURE
$IRECTæOUTSTANDINGS $177 $ 62 $13 $252 æ æ
5NFUNDEDæLENDINGæCOMMITMENTS 144 151 21 316
Total $321 $213 $34 $568
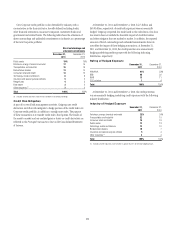
Portfolio Mix
Citi’s Corporate credit portfolio is diverse across geography and counterparty.
The following table shows the percentage of direct outstandings and
unfunded commitments by region:
December 31,
2011
$ECEMBERææ
North America 47%
EMEA 27
Latin America 8
Asia 18
Total 100%
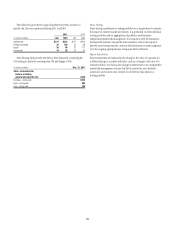
The maintenance of accurate and consistent risk ratings across the
Corporate credit portfolio facilitates the comparison of credit exposure across
all lines of business, geographic regions and products.
Obligor risk ratings reflect an estimated probability of default for an
obligor and are derived primarily through the use of validated statistical
models, scorecard models and external agency ratings (under defined
circumstances), in combination with consideration of factors specific to the
obligor or market, such as management experience, competitive position,
and regulatory environment. Facility risk ratings are assigned that reflect
the probability of default of the obligor and factors that affect the loss-given
default of the facility, such as support or collateral. Internal obligor ratings
that generally correspond to BBB and above are considered investment grade,
while those below are considered non-investment grade.
Citigroup also has incorporated climate risk assessment criteria for certain
obligors, as necessary. Factors evaluated include consideration of climate risk
to an obligor’s business and physical assets.
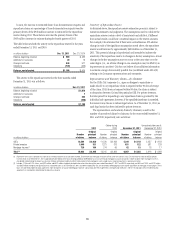
The following table presents the Corporate credit portfolio by facility risk
rating at December 31, 2011 and December 31, 2010, as a percentage of the
total portfolio:
Direct outstandings and
unfunded commitments
December 31,
2011
$ECEMBERææ
!!!!!! 55%
""" 29
""" 13
###æORæBELOW 2
5NRATED 1
Total 100%