Citibank 2011 Annual Report Download - page 221
Download and view the complete annual report
Please find page 221 of the 2011 Citibank annual report below. You can navigate through the pages in the report by either clicking on the pages listed below, or by using the keyword search tool below to find specific information within the annual report.-
 1
1 -
2
-
3
-
4
-
5
-
6
-
7
-
8
-
9
-
10
-
11
-
12
-
13
-
14
-
15
-
16
-
17
-
18
-
19
-
20
-
21
-
22
-
23
-
24
-
25
-
26
-
27
-
28
-
29
-
30
-
31
-
32
-
33
-
34
-
35
-
36
-
37
-
38
-
39
-
40
-
41
-
42
-
43
-
44
-
45
-
46
-
47
-
48
-
49
-
50
-
51
-
52
-
53
-
54
-
55
-
56
-
57
-
58
-
59
-
60
-
61
-
62
-
63
-
64
-
65
-
66
-
67
-
68
-
69
-
70
-
71
-
72
-
73
-
74
-
75
-
76
-
77
-
78
-
79
-
80
-
81
-
82
-
83
-
84
-
85
-
86
-
87
-
88
-
89
-
90
-
91
-
92
-
93
-
94
-
95
-
96
-
97
-
98
-
99
-
100
-
101
-
102
-
103
-
104
-
105
-
106
-
107
-
108
-
109
-
110
-
111
-
112
-
113
-
114
-
115
-
116
-
117
-
118
-
119
-
120
-
121
-
122
-
123
-
124
-
125
-
126
-
127
-
128
-
129
-
130
-
131
-
132
-
133
-
134
-
135
-
136
-
137
-
138
-
139
-
140
-
141
-
142
-
143
-
144
-
145
-
146
-
147
-
148
-
149
-
150
-
151
-
152
-
153
-
154
-
155
-
156
-
157
-
158
-
159
-
160
-
161
-
162
-
163
-
164
-
165
-
166
-
167
-
168
-
169
-
170
-
171
-
172
-
173
-
174
-
175
-
176
-
177
-
178
-
179
-
180
-
181
-
182
-
183
-
184
-
185
-
186
-
187
-
188
-
189
-
190
-
191
-
192
-
193
-
194
-
195
-
196
-
197
-
198
-
199
-
200
-
201
-
202
-
203
-
204
-
205
-
206
-
207
-
208
-
209
-
210
-
 211
211 -
 212
212 -
 213
213 -
 214
214 -
 215
215 -
 216
216 -
 217
217 -
 218
218 -
 219
219 -
 220
220 -
 221
221 -
 222
222 -
 223
223 -
 224
224 -
 225
225 -
 226
226 -
 227
227 -
 228
228 -
 229
229 -
 230
230 -
 231
231 -
232
-
233
-
234
-
235
-
236
-
237
-
238
-
239
-
240
-
241
-
242
-
243
-
244
-
245
-
246
-
247
-
248
-
249
-
250
-
251
-
252
-
253
-
254
-
255
-
256
-
257
-
258
-
259
-
260
-
261
-
262
-
263
-
264
-
265
-
266
-
267
-
268
-
269
-
270
-
271
-
272
-
273
-
274
-
275
-
276
-
277
-
278
-
279
-
280
-
281
-
282
-
283
-
284
-
285
-
286
-
287
-
288
-
289
-
290
-
291
-
292
-
293
-
294
-
295
-
296
-
297
-
298
-
299
-
300
-
301
-
302
-
303
-
304
-
305
-
306
-
307
-
308
-
309
-
310
-
311
-
312
-
313
-
314
-
315
-
316
-
317
-
318
-
319
-
320
 |
 |

199
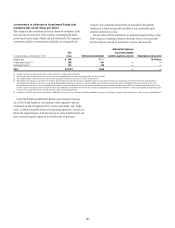
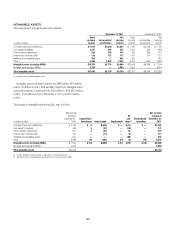
The following table presents loans that defaulted during 2011 and for which
the payment default occurred within one year of the modification.
In millions of dollars
Year ended
December 31, 2011 (1)
North America
2ESIDENTIALæFIRSTæMORTGAGES $1,932
(OMEæEQUITYæLOANS 105
#REDITæCARDS 1,307
)NSTALLMENTæANDæOTHERæREVOLVING 103
#OMMERCIALæMARKETSæ 3
Total $3,450
International
2ESIDENTIALæFIRSTæMORTGAGES $ 103
(OMEæEQUITYæLOANS 2
#REDITæCARDS 359
)NSTALLMENTæANDæOTHERæREVOLVING 250
#OMMERCIALæMARKETSæ 14
Total $ 728
æ $EFAULTæISæDEFINEDæASææDAYSæPASTæDUEæEXCEPTæFORæCLASSIFIABLYæMANAGEDæCOMMERCIALæMARKETSæLOANSæ
WHEREæDEFAULTæISæDEFINEDæASææDAYSæPASTæDUE
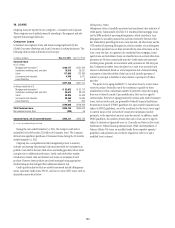
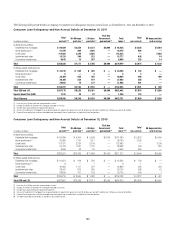
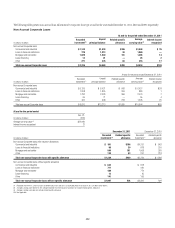
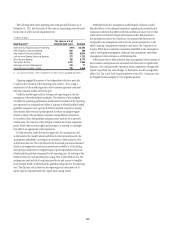
Corporate Loans
Corporate loans represent loans and leases managed by ICG or the SAP.
The following table presents information by Corporate loan type as of
December 31, 2011 and December 31, 2010:
In millions of dollars
Dec. 31,
2011
æ$ECæ
Corporate æ
)Næ53æOFFICES æ
#OMMERCIALæANDæINDUSTRIALæ $ 21,667
,OANSæTOæFINANCIALæINSTITUTIONS 33,265
-ORTGAGEæANDæREALæESTATEæ 20,698
)NSTALLMENTæREVOLVINGæCREDITæANDæOTHER 15,011
,EASEæFINANCING 1,270
$ 91,911
)NæOFFICESæOUTSIDEæTHEæ53
#OMMERCIALæANDæINDUSTRIAL $ 79,373
)NSTALLMENTæREVOLVINGæCREDITæANDæOTHER 14,114
-ORTGAGEæANDæREALæESTATEæ 6,885
,OANSæTOæFINANCIALæINSTITUTIONS 29,794
,EASEæFINANCING 568
'OVERNMENTSæANDæOFFICIALæINSTITUTIONS 1,576
$132,310
Total Corporate loans $224,221
.ETæUNEARNEDæINCOMEæLOSSæ (710)
Corporate loans, net of unearned income $223,511
ææ ,OANSæSECUREDæPRIMARILYæBYæREALæESTATE
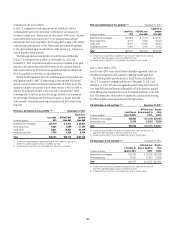
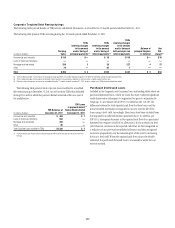
For the year ended December 31, 2011, the Company sold and/or
reclassified (to held-for-sale) $6.4 billion of held-for-investment Corporate
loans. The Company did not have significant purchases of loans classified as
held-for-investment for the year ended December 31, 2011.
Corporate loans are identified as impaired and placed on a cash
(non-accrual) basis when it is determined, based on actual experience and
a forward-looking assessment of the collectability of the loan in full, that
the payment of interest or principal is doubtful or when interest or principal
is 90 days past due, except when the loan is well collateralized and in the
process of collection. Any interest accrued on impaired Corporate loans
and leases is reversed at 90 days and charged against current earnings,
and interest is thereafter included in earnings only to the extent actually
received in cash. When there is doubt regarding the ultimate collectability
of principal, all cash receipts are thereafter applied to reduce the recorded
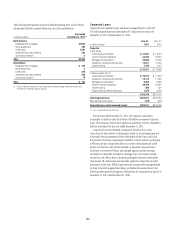
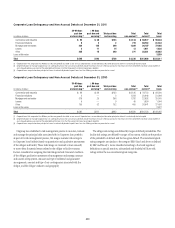
investment in the loan. While Corporate loans are generally managed based
on their internally assigned risk rating (see further discussion below), the
following tables present delinquency information by Corporate loan type as of
December 31, 2011 and December 31, 2010: