Citibank 2011 Annual Report Download - page 265
Download and view the complete annual report
Please find page 265 of the 2011 Citibank annual report below. You can navigate through the pages in the report by either clicking on the pages listed below, or by using the keyword search tool below to find specific information within the annual report.-
 1
1 -
2
-
3
-
4
-
5
-
6
-
7
-
8
-
9
-
10
-
11
-
12
-
13
-
14
-
15
-
16
-
17
-
18
-
19
-
20
-
21
-
22
-
23
-
24
-
25
-
26
-
27
-
28
-
29
-
30
-
31
-
32
-
33
-
34
-
35
-
36
-
37
-
38
-
39
-
40
-
41
-
42
-
43
-
44
-
45
-
46
-
47
-
48
-
49
-
50
-
51
-
52
-
53
-
54
-
55
-
56
-
57
-
58
-
59
-
60
-
61
-
62
-
63
-
64
-
65
-
66
-
67
-
68
-
69
-
70
-
71
-
72
-
73
-
74
-
75
-
76
-
77
-
78
-
79
-
80
-
81
-
82
-
83
-
84
-
85
-
86
-
87
-
88
-
89
-
90
-
91
-
92
-
93
-
94
-
95
-
96
-
97
-
98
-
99
-
100
-
101
-
102
-
103
-
104
-
105
-
106
-
107
-
108
-
109
-
110
-
111
-
112
-
113
-
114
-
115
-
116
-
117
-
118
-
119
-
120
-
121
-
122
-
123
-
124
-
125
-
126
-
127
-
128
-
129
-
130
-
131
-
132
-
133
-
134
-
135
-
136
-
137
-
138
-
139
-
140
-
141
-
142
-
143
-
144
-
145
-
146
-
147
-
148
-
149
-
150
-
151
-
152
-
153
-
154
-
155
-
156
-
157
-
158
-
159
-
160
-
161
-
162
-
163
-
164
-
165
-
166
-
167
-
168
-
169
-
170
-
171
-
172
-
173
-
174
-
175
-
176
-
177
-
178
-
179
-
180
-
181
-
182
-
183
-
184
-
185
-
186
-
187
-
188
-
189
-
190
-
191
-
192
-
193
-
194
-
195
-
196
-
197
-
198
-
199
-
200
-
201
-
202
-
203
-
204
-
205
-
206
-
207
-
208
-
209
-
210
-
211
-
212
-
213
-
214
-
215
-
216
-
217
-
218
-
219
-
220
-
221
-
222
-
223
-
224
-
225
-
226
-
227
-
228
-
229
-
230
-
231
-
232
-
233
-
234
-
235
-
236
-
237
-
238
-
239
-
240
-
241
-
242
-
243
-
244
-
245
-
246
-
247
-
248
-
249
-
250
-
251
-
252
-
253
-
254
-
 255
255 -
 256
256 -
 257
257 -
 258
258 -
 259
259 -
 260
260 -
 261
261 -
 262
262 -
 263
263 -
 264
264 -
 265
265 -
 266
266 -
 267
267 -
 268
268 -
 269
269 -
 270
270 -
 271
271 -
 272
272 -
 273
273 -
 274
274 -
 275
275 -
276
-
277
-
278
-
279
-
280
-
281
-
282
-
283
-
284
-
285
-
286
-
287
-
288
-
289
-
290
-
291
-
292
-
293
-
294
-
295
-
296
-
297
-
298
-
299
-
300
-
301
-
302
-
303
-
304
-
305
-
306
-
307
-
308
-
309
-
310
-
311
-
312
-
313
-
314
-
315
-
316
-
317
-
318
-
319
-
320
 |
 |
243
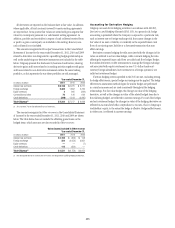
Trading account assets and liabilities—derivatives
Exchange-traded derivatives are generally fair valued using quoted market
(i.e., exchange) prices and so are classified as Level 1 of the fair value
hierarchy.
The majority of derivatives entered into by the Company are executed
over the counter and so are valued using internal valuation techniques as no
quoted market prices exist for such instruments. The valuation techniques
and inputs depend on the type of derivative and the nature of the underlying
instrument. The principal techniques used to value these instruments are
discounted cash flows, Black-Scholes and Monte Carlo simulation. The fair
values of derivative contracts reflect cash the Company has paid or received
(for example, option premiums paid and received).
The key inputs depend upon the type of derivative and the nature of
the underlying instrument and include interest rate yield curves, foreign-
exchange rates, the spot price of the underlying volatility and correlation.
The item is placed in either Level 2 or Level 3 depending on the observability
of the significant inputs to the model. Correlation and items with longer
tenors are generally less observable.
In the fourth quarter of 2011, the Company began incorporating
overnight indexed swap (“OIS”) curves as fair value measurement inputs for
the valuation of certain collateralized interest-rate related derivatives. The
OIS curves reflect the interest rates paid on cash collateral provided against
the fair value of these derivatives. The Company believes using relevant OIS
curves as inputs to determine fair value measurements provides a more
representative reflection of the fair value of these collateralized interest-rate
related derivatives. Previously, the Company used the relevant benchmark
curve for the currency of the derivative (e.g., the London Interbank Offered
Rate for U.S. dollar derivatives) as the discount rate for these collateralized
interest-rate related derivatives. The Company recognized a pretax gain of
approximately $167 million upon the change in this fair value measurement
input. For further information on derivative instruments and hedging
activities, see Note 23.
Subprime-related direct exposures in CDOS
The valuation of high-grade and mezzanine asset-backed security (ABS)
CDO positions uses trader prices based on the underlying assets of each high-
grade and mezzanine ABS CDO. The high-grade and mezzanine positions
are now largely hedged through the ABX and bond short positions, which
are trader priced. This results in closer symmetry in the way these long and
short positions are valued by the Company. Citigroup uses trader marks
to value this portion of the portfolio and will do so as long as it remains
largely hedged.
For most of the lending and structuring direct subprime exposures,
fair value is determined utilizing observable transactions where available,
other market data for similar assets in markets that are not active and other
internal valuation techniques.
Investments
The investments category includes available-for-sale debt and marketable
equity securities, whose fair value is determined using the same procedures
described for trading securities above or, in some cases, using vendor prices
as the primary source.
Also included in investments are nonpublic investments in private equity
and real estate entities held by the S&B business. Determining the fair
value of nonpublic securities involves a significant degree of management
resources and judgment as no quoted prices exist and such securities are
generally very thinly traded. In addition, there may be transfer restrictions
on private equity securities. The Company uses an established process for
determining the fair value of such securities, using commonly accepted
valuation techniques, including the use of earnings multiples based on
comparable public securities, industry-specific non-earnings-based multiples
and discounted cash flow models. In determining the fair value of nonpublic
securities, the Company also considers events such as a proposed sale of
the investee company, initial public offerings, equity issuances or other
observable transactions. As discussed in Note 15 to the Consolidated Financial
Statements, the Company uses NAV to value certain of these entities.
Private equity securities are generally classified as Level 3 of the fair value
hierarchy.
Short-term borrowings and long-term debt
Where fair value accounting has been elected, the fair values of non-
structured liabilities are determined by discounting expected cash flows using
the appropriate discount rate for the applicable maturity. Such instruments
are generally classified as Level 2 of the fair value hierarchy as all inputs are
readily observable.
The Company determines the fair values of structured liabilities (where
performance is linked to structured interest rates, inflation or currency risks)
and hybrid financial instruments (performance linked to risks other than
interest rates, inflation or currency risks) using the appropriate derivative
valuation methodology (described above) given the nature of the embedded
risk profile. Such instruments are classified as Level 2 or Level 3 depending
on the observability of significant inputs to the model.