Capital One 2010 Annual Report Download - page 98
Download and view the complete annual report
Please find page 98 of the 2010 Capital One annual report below. You can navigate through the pages in the report by either clicking on the pages listed below, or by using the keyword search tool below to find specific information within the annual report.-
 1
1 -
2
-
3
-
4
-
5
-
6
-
7
-
8
-
9
-
10
-
11
-
12
-
13
-
14
-
15
-
16
-
17
-
18
-
19
-
20
-
21
-
22
-
23
-
24
-
25
-
26
-
27
-
28
-
29
-
30
-
31
-
32
-
33
-
34
-
35
-
36
-
37
-
38
-
39
-
40
-
41
-
42
-
43
-
44
-
45
-
46
-
47
-
48
-
49
-
50
-
51
-
52
-
53
-
54
-
55
-
56
-
57
-
58
-
59
-
60
-
61
-
62
-
63
-
64
-
65
-
66
-
67
-
68
-
69
-
70
-
71
-
72
-
73
-
74
-
75
-
76
-
77
-
78
-
79
-
80
-
81
-
82
-
83
-
84
-
85
-
86
-
87
-
 88
88 -
 89
89 -
 90
90 -
 91
91 -
 92
92 -
 93
93 -
 94
94 -
 95
95 -
 96
96 -
 97
97 -
 98
98 -
 99
99 -
 100
100 -
 101
101 -
 102
102 -
 103
103 -
 104
104 -
 105
105 -
 106
106 -
 107
107 -
 108
108 -
109
-
110
-
111
-
112
-
113
-
114
-
115
-
116
-
117
-
118
-
119
-
120
-
121
-
122
-
123
-
124
-
125
-
126
-
127
-
128
-
129
-
130
-
131
-
132
-
133
-
134
-
135
-
136
-
137
-
138
-
139
-
140
-
141
-
142
-
143
-
144
-
145
-
146
-
147
-
148
-
149
-
150
-
151
-
152
-
153
-
154
-
155
-
156
-
157
-
158
-
159
-
160
-
161
-
162
-
163
-
164
-
165
-
166
-
167
-
168
-
169
-
170
-
171
-
172
-
173
-
174
-
175
-
176
-
177
-
178
-
179
-
180
-
181
-
182
-
183
-
184
-
185
-
186
-
187
-
188
-
189
-
190
-
191
-
192
-
193
-
194
-
195
-
196
-
197
-
198
-
199
-
200
-
201
-
202
-
203
-
204
-
205
-
206
-
207
-
208
-
209
-
210
-
211
-
212
-
213
-
214
-
215
-
216
-
217
-
218
-
219
-
220
-
221
-
222
-
223
-
224
-
225
-
226
 |
 |

78
In the fourth quarter of 2010, we participated in a Federal Reserve led Capital Plan Review and stress test along with 19 other top U.S.
banks. We will incorporate any feedback from our regulators in response to the Capital Plan Review in our ongoing capital
management actions.
MARKET RISK MANAGEMENT
Market risk generally represents the risk that our earnings and/or economic value of equity may be adversely affected by changes in
market conditions. Market risk is inherent in the financial instruments associated with our operations and activities, including loans,
deposits, securities, short-term borrowings, long-term debt and derivatives. Market conditions that may change from time to time,
thereby exposing us to market risk, include changes in interest rates and currency exchange rates, credit spreads and price fluctuation
or changes in value due to changes in market perception or actual credit quality of issuers. Our most significant market risks include
our exposure to interest rate and foreign exchange risk.
We have prescribed risk management policies and limits established by our Asset/Liability Management Committee. Our objective is
to manage our asset/liability risk position and exposure to market risk in accordance with these policies and prescribed limits based on
prevailing market conditions and long-term expectations. Because no single measure can reflect all aspects of market risk, we use
various industry standard market risk measurement techniques and analyses to measure, assess and manage the impact of changes in
interest rates and foreign exchange rates on our earnings and the economic value of equity.
Interest Rate Risk
Interest rate risk, which represents exposure to instruments whose values vary with the level or volatility of interest rates, is our most
significant market risk exposure. Banks are inevitably exposed to interest rate risk due to differences in the timing between the
maturity or repricing of assets and liabilities. For example, if more assets are repricing than deposits and other borrowings when
general interest rates are declining, our earnings will decrease initially. Similarly, if more deposits and other borrowings are repricing
than assets when general interest rates are rising, our earnings will decrease initially.
Interest rate risk also results from changes in customer behavior and competitors’ responses to changes in interest rates or other market
conditions. For example, decreases in mortgage interest rates generally results in faster than expected prepayments, which may
adversely affect earnings. Increases in interest rates, coupled with strong demand from competitors for deposits, may influence
industry pricing. Such competition may affect customer decisions to maintain balances in the deposit accounts, which may require
replacing lower cost deposits with higher cost alternative sources of funding.
We employ several strategies to manage our interest rate risk, which include, but are not limited to, changing the maturity and re-
pricing characteristics of our various assets and liabilities and using interest rate derivatives. We consider the impact on both earnings
and economic value of equity in measuring and managing our interest rate risk.
Our earnings sensitivity measure estimates the impact on net interest income and the valuation of our mortgage servicing rights (net of
derivatives) as a result of movements in interest rates. Our economic value of equity sensitivity measure estimates the impact on the
net preset value of our assets and liabilities, including derivatives, as a result of movements in interest rates. Our earnings sensitivity
and economic value of equity measurements are based on our existing assets and liabilities, including our derivatives, and do not
incorporate business growth assumptions or projected plans for funding mix changes. However, we also assess the potential impact of
growth assumptions, changing business activities, alternative interest rate scenarios and changing market environments, which we
factor into our interest rate risk management decisions.
Under our current asset/liability management policy, we seek to limit the potential decrease in our projected net interest income
resulting from a gradual plus or minus 200 basis point change in forward rates to less than 5% over the next 12 months. Our current
asset/liability management policy also includes limiting the adverse change in the economic value of our equity due to an
instantaneous parallel interest rate shock to spot rates of plus or minus 200 basis points to less than 12%. The federal funds rate
remained at a target range of zero to 0.25% throughout 2010. Given the level of short-term rates as of December 31, 2010 and 2009, a
scenario where interest rates would decline by 200 basis points is not plausible. We therefore revised our customary declining interest
rate scenario of 200 basis points to a 50 basis point decrease.
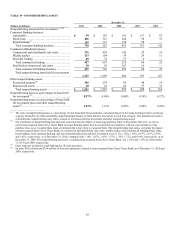
Table 37 compares the estimated impact on net interest income and the economic value of equity of our selected hypothetical interest
rate scenarios as of December 31, 2010 and 2009. All changes in income and value are measured as percentage changes from the
projected net interest income and economic value of our equity at the base interest rate scenario. Our earnings and economic value
sensitivity measures were low and within our prescribed asset/liability policy limits as of December 31, 2010 and 2009.