Capital One 2010 Annual Report Download - page 106
Download and view the complete annual report
Please find page 106 of the 2010 Capital One annual report below. You can navigate through the pages in the report by either clicking on the pages listed below, or by using the keyword search tool below to find specific information within the annual report.-
 1
1 -
2
-
3
-
4
-
5
-
6
-
7
-
8
-
9
-
10
-
11
-
12
-
13
-
14
-
15
-
16
-
17
-
18
-
19
-
20
-
21
-
22
-
23
-
24
-
25
-
26
-
27
-
28
-
29
-
30
-
31
-
32
-
33
-
34
-
35
-
36
-
37
-
38
-
39
-
40
-
41
-
42
-
43
-
44
-
45
-
46
-
47
-
48
-
49
-
50
-
51
-
52
-
53
-
54
-
55
-
56
-
57
-
58
-
59
-
60
-
61
-
62
-
63
-
64
-
65
-
66
-
67
-
68
-
69
-
70
-
71
-
72
-
73
-
74
-
75
-
76
-
77
-
78
-
79
-
80
-
81
-
82
-
83
-
84
-
85
-
86
-
87
-
88
-
89
-
90
-
91
-
92
-
93
-
94
-
95
-
 96
96 -
 97
97 -
 98
98 -
 99
99 -
 100
100 -
 101
101 -
 102
102 -
 103
103 -
 104
104 -
 105
105 -
 106
106 -
 107
107 -
 108
108 -
 109
109 -
 110
110 -
 111
111 -
 112
112 -
 113
113 -
 114
114 -
 115
115 -
 116
116 -
117
-
118
-
119
-
120
-
121
-
122
-
123
-
124
-
125
-
126
-
127
-
128
-
129
-
130
-
131
-
132
-
133
-
134
-
135
-
136
-
137
-
138
-
139
-
140
-
141
-
142
-
143
-
144
-
145
-
146
-
147
-
148
-
149
-
150
-
151
-
152
-
153
-
154
-
155
-
156
-
157
-
158
-
159
-
160
-
161
-
162
-
163
-
164
-
165
-
166
-
167
-
168
-
169
-
170
-
171
-
172
-
173
-
174
-
175
-
176
-
177
-
178
-
179
-
180
-
181
-
182
-
183
-
184
-
185
-
186
-
187
-
188
-
189
-
190
-
191
-
192
-
193
-
194
-
195
-
196
-
197
-
198
-
199
-
200
-
201
-
202
-
203
-
204
-
205
-
206
-
207
-
208
-
209
-
210
-
211
-
212
-
213
-
214
-
215
-
216
-
217
-
218
-
219
-
220
-
221
-
222
-
223
-
224
-
225
-
226
 |
 |

86
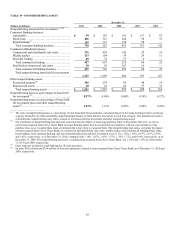
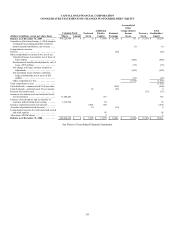
TABLE E—NET CHARGE-OFFS(1)
Year Ended December 31,
(Dollars in millions) 2010 2009 2008 2007 2006
Reported:
Average loans held for investment(2) .............
.
$ 128,526 $ 99,787 $ 98,971 $ 93,542 $ 63,577
N
et charge-offs ................................
.
6,651 4,568 3,478 1,961 1,407
N
et charge-offs rate(3) ...........................
.
5.18% 4.58% 3.51% 2.10% 2.21%
Managed:
Average loans held for investment(2) .............
.
$ 128,622 $ 143,514 $ 147,812 $ 144,727 $ 111,329
N
et charge-offs ................................
.
6,657 8,421 6,425 4,162 3,158
N
et charge-off rate(3) ...........................
.
5.18% 5.87% 4.35% 2.88% 2.84%
________________________
(1) Net charge-offs reflect charge-offs, net of recoveries, related to our total loan portfolio, which we previously referred to as our “managed” loan
portfolio. The total loan portfolio includes loans recorded on our balance sheet and loans held in our securitization trusts.
(2) The average balances of the acquired Chevy Chase Bank loan portfolio, which are included in the total average loans held for investment used in
calculating the net charge-off rates, were $6.3 billion and $6.8 billion for the years ended December 31, 2010 and 2009, respectively.
(3) Calculated for each loan category by dividing annualized net charge-offs for the period divided by average loans held for investment during the
period.