Capital One 2010 Annual Report Download - page 82
Download and view the complete annual report
Please find page 82 of the 2010 Capital One annual report below. You can navigate through the pages in the report by either clicking on the pages listed below, or by using the keyword search tool below to find specific information within the annual report.-
 1
1 -
2
-
3
-
4
-
5
-
6
-
7
-
8
-
9
-
10
-
11
-
12
-
13
-
14
-
15
-
16
-
17
-
18
-
19
-
20
-
21
-
22
-
23
-
24
-
25
-
26
-
27
-
28
-
29
-
30
-
31
-
32
-
33
-
34
-
35
-
36
-
37
-
38
-
39
-
40
-
41
-
42
-
43
-
44
-
45
-
46
-
47
-
48
-
49
-
50
-
51
-
52
-
53
-
54
-
55
-
56
-
57
-
58
-
59
-
60
-
61
-
62
-
63
-
64
-
65
-
66
-
67
-
68
-
69
-
70
-
71
-
 72
72 -
 73
73 -
 74
74 -
 75
75 -
 76
76 -
 77
77 -
 78
78 -
 79
79 -
 80
80 -
 81
81 -
 82
82 -
 83
83 -
 84
84 -
 85
85 -
 86
86 -
 87
87 -
 88
88 -
 89
89 -
 90
90 -
 91
91 -
 92
92 -
93
-
94
-
95
-
96
-
97
-
98
-
99
-
100
-
101
-
102
-
103
-
104
-
105
-
106
-
107
-
108
-
109
-
110
-
111
-
112
-
113
-
114
-
115
-
116
-
117
-
118
-
119
-
120
-
121
-
122
-
123
-
124
-
125
-
126
-
127
-
128
-
129
-
130
-
131
-
132
-
133
-
134
-
135
-
136
-
137
-
138
-
139
-
140
-
141
-
142
-
143
-
144
-
145
-
146
-
147
-
148
-
149
-
150
-
151
-
152
-
153
-
154
-
155
-
156
-
157
-
158
-
159
-
160
-
161
-
162
-
163
-
164
-
165
-
166
-
167
-
168
-
169
-
170
-
171
-
172
-
173
-
174
-
175
-
176
-
177
-
178
-
179
-
180
-
181
-
182
-
183
-
184
-
185
-
186
-
187
-
188
-
189
-
190
-
191
-
192
-
193
-
194
-
195
-
196
-
197
-
198
-
199
-
200
-
201
-
202
-
203
-
204
-
205
-
206
-
207
-
208
-
209
-
210
-
211
-
212
-
213
-
214
-
215
-
216
-
217
-
218
-
219
-
220
-
221
-
222
-
223
-
224
-
225
-
226
 |
 |

62
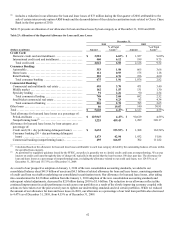
(2) Includes a reduction in our allowance for loan and lease losses of $73 million during the first quarter of 2010 attributable to the
sale of certain interest-only option-ARM bonds and the deconsolidation of the related securitization trusts related to Chevy Chase
Bank in the first quarter of 2010.
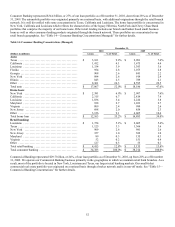
Table 23 presents an allocation of our allowance for loan and lease losses by loan category as of December 31, 2010 and 2009.
Table 23: Allocation of the Reported Allowance for Loan and Lease Losses
December 31,
2010 2009
(Dollars in millions) Amount
% of Total
Loans(1) Amount
% of Total
Loans(1)
Credit Card:
Domestic credit card and installment ...................... $ 3,581 6.65% $ 1,927 9.60%
International credit card and installment ................... 460 6.12 199 8.75
Total credit card ...................................... 4,041 6.58 2,126 9.52
Consumer Banking:
Automobile ............................................. 353 1.98 665 3.66
Home loans ............................................ 112 0.93 175 1.18
Retail banking .......................................... 210 4.76 236 4.60
Total consumer banking ............................... 675 1.96 1,076 2.82
Commercial Banking:
Commercial and multifamily real estate ................... 495 3.70 471 3.40
Middle market .......................................... 162 1.55 131 1.30
Specialty lending ....................................... 91 2.26 90 2.54
Total commercial lending .............................. 748 2.68 692 2.52
Small-ticket commercial real estate ....................... 78 4.23 93 4.34
Total commercial banking ............................. 826 2.78 785 2.65
Other loans ............................................... 86 19.07 140 30.91
Total ..................................................... $ 5,628 4.47% $ 4,127 4.55%
Total allowance for loan and lease losses as a percentage of:
Period-end loans ........................................ $ 125,947 4.47% $ 90,619 4.55%
Nonperforming loans(2) .................................. 1,225 459.43 1,289 320.17
Allowance for loan and lease losses, by loan category, as a
percentage of:
Credit card (30 + day performing delinquent loans) ........ $ 2,632 153.53% $ 1,308 162.54%
Consumer banking (30 + day performing delinquent
loans) ................................................ 1,473 42.94 1,932 51.86
Commercial banking (nonperforming loans) ............... 495 166.87 702 111.82
________________________
(1) Calculated based on the allowance for loan and lease losses attributable to each loan category divided by the outstanding balance of loans within
the specified loan category.
(2) As permitted by regulatory guidance issued by the FFEIC, our policy is generally not to classify credit card loans as nonperforming. We accrue
interest on credit card loans through the date of charge-off, typically in the period that the loan becomes 180 days past due. The allowance for
loan and lease losses as a percentage of nonperforming loans, excluding the allowance related to our credit card loans, was 129.55% as of
December 31, 2010 and 155.33% as of December 31, 2009.
As a result of our prospective adoption on January 1, 2010 of the new consolidation accounting standards, we added to our
consolidated balance sheet $41.9 billion of assets and $4.3 billion of related allowance for loan and lease losses, consisting primarily
of credit card loan receivables underlying our consolidated securitization trusts. Our allowance for loan and lease losses, after taking
into consideration the $4.3 billion addition from the January 1, 2010 adoption of the new consolidation accounting standards and
subsequent related adjustments, decreased by $2.8 billion during 2010 to $5.6 billion. The reduction in our allowance reflected the
continued improvement in credit performance trends across our portfolios as a result of the slowly improving economy coupled with
actions we have taken over the past several years to tighten our underwriting standards and exit certain portfolios. While we reduced
the amount of our allowance for loan and lease losses in 2010, our allowance as a percentage of our total loan portfolio also decreased
to 4.47% as of December 31, 2010, from 4.55% as of December 31, 2009.