Capital One 2010 Annual Report Download - page 64
Download and view the complete annual report
Please find page 64 of the 2010 Capital One annual report below. You can navigate through the pages in the report by either clicking on the pages listed below, or by using the keyword search tool below to find specific information within the annual report.
44
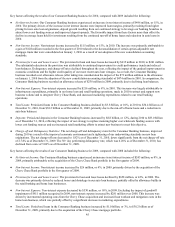
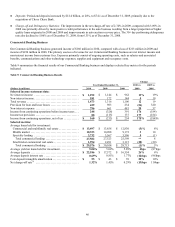
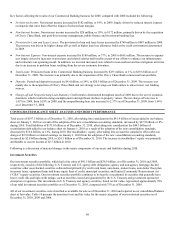
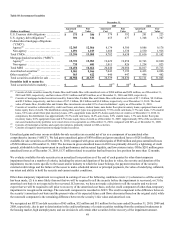
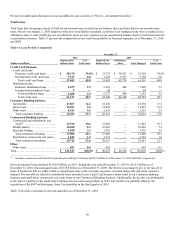
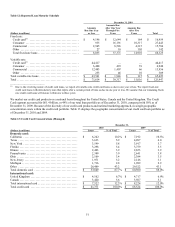
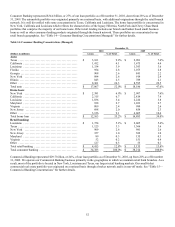
Table 8: Consumer Banking Business Results
Change
Year Ended December 31, 2010 vs. 2009 vs.
(Dollars in millions) 2010 2009 2008 2009 2008
Selected income statement data:
N
et interest income .................................... $ 3,727 $ 3,231 $ 2,988 15% 8%
N
on-interest income .................................... 870 755 729 15 4
Total revenue .......................................... 4,597 3,986 3,717 15 7
Provision for loan and lease losses ....................... 241 876 1,534 (72) (43)
N
on-interest expense(1) ................................. 2,950 2,734 3,264 8 (16)
Income from continuing operations before income taxes ... 1,406 376 (1,081) 274 135
Income tax provision ................................... 501 132 (101) 280 231
Income from continuing operations, net of tax ............ $ 905 $ 244 $ (980) 271% 125%
Selected metrics:
Average loans held for investment:
Automobile .......................................... $ 17,551 $ 19,950 $ 23,490 (12)% (15)%
Home loan .......................................... 13,629 14,434 10,406 (6) 39
Retail banking ....................................... 4,745 5,490 5,449 (14) 1
Total consumer banking ............................ $ 35,925 $ 39,874 $ 39,345 (10)% 1%
Average yield on loans held for investment ............... 9.11% 8.94% 9.69% 17 bps (75)bps
Average deposits ....................................... $ 78,083 $ 70,862 $ 56,998 10% 24%
Average deposit interest rate ............................ 1.19% 1.68% 2.52% (49)bps (84)bps
Core deposit intangible amortization ..................... $ 144 $ 169 $ 153 (15)% 10%
N
et charge-off rate(2) ................................... 1.82% 2.74% 3.09% (92)bps (35)bps
Automobile loan originations ........................... $ 7,764 $ 5,336 $ 6,874 46% (22)%
December 31,
(Dollars in millions) 2010 2009 Change
Selected period-end data:
Loans held for investment:
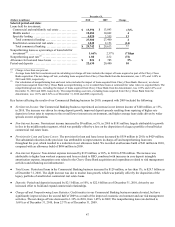
Automobile ......................................... $ 17,867 $ 18,186 (2)%
Home loan ......................................... 12,103 14,893 (19)
Retail banking ...................................... 4,413 5,135 (14)
Total consumer banking ............................. $ 34,383 $ 38,214 (10)%
N
onperforming loans as a percentage of loans held for
investment(3) ........................................ 1.97% 1.45% 52 bps
N
onperforming asset rate(3) ............................ 2.17 1.60 57
30+ day performing delinquency rate(4) ................. 4.28 5.06 (78)
Allowance for loan and lease losses(5) ................... $ 675 $ 1,076 (37)%
Period-end deposits ................................... 82,959 74,145 12
Period-end loans serviced for others .................... 20,689 30,283 (32)
________________________
(1) Non-interest expense for 2008 includes goodwill impairment of $811 million attributable to the Consumer Banking business.
(2) Average loans held for investment used in calculating net charge-off rates includes the impact of loans acquired as part of the Chevy Chase
Bank acquisition. The net charge-off rate, excluding loans acquired from Chevy Chase Bank from the denominator, was 2.16% and 3.17% in
2010 and 2009, respectively.
(3) Our calculation of nonperforming loan and asset ratios includes the impact of loans acquired from Chevy Chase Bank. However, we do not
report loans acquired from Chevy Chase Bank as nonperforming, as we recorded these loans at estimated fair value when we acquired them. The
nonperforming loan ratio, excluding the impact of loans acquired from Chevy Chase Bank from the denominator, was 2.30% and 1.75% as of
December 31, 2010 and 2009, respectively. Nonperforming assets consist of nonperforming loans and real-estate owned (“REO”). The
nonperforming asset rate is calculated by dividing nonperforming assets as of the end of the period by period-end loans held for investment and
REO. The nonperforming asset rate, excluding loans acquired from Chevy Chase Bank from the denominator, was 2.54% and 1.93% as of
December 31, 2010 and 2009, respectively.
(4) The 30+ day performing delinquency rate, excluding loans acquired from Chevy Chase Bank from the denominator, was 5.01% as of December
31, 2010 and 6.10% as of December 31, 2009.
(5) As a result of the January 1, 2010 adoption of the new consolidation accounting standards, we added $73 million to the allowance related to our
Consumer Banking business on January 1, 2010, resulting in an allowance of $1.1 billion as of January 1, 2010. The allowance decreased during
the remainder of 2010 by $474 million, or 43%.


