Capital One 2010 Annual Report Download - page 134
Download and view the complete annual report
Please find page 134 of the 2010 Capital One annual report below. You can navigate through the pages in the report by either clicking on the pages listed below, or by using the keyword search tool below to find specific information within the annual report.-
 1
1 -
2
-
3
-
4
-
5
-
6
-
7
-
8
-
9
-
10
-
11
-
12
-
13
-
14
-
15
-
16
-
17
-
18
-
19
-
20
-
21
-
22
-
23
-
24
-
25
-
26
-
27
-
28
-
29
-
30
-
31
-
32
-
33
-
34
-
35
-
36
-
37
-
38
-
39
-
40
-
41
-
42
-
43
-
44
-
45
-
46
-
47
-
48
-
49
-
50
-
51
-
52
-
53
-
54
-
55
-
56
-
57
-
58
-
59
-
60
-
61
-
62
-
63
-
64
-
65
-
66
-
67
-
68
-
69
-
70
-
71
-
72
-
73
-
74
-
75
-
76
-
77
-
78
-
79
-
80
-
81
-
82
-
83
-
84
-
85
-
86
-
87
-
88
-
89
-
90
-
91
-
92
-
93
-
94
-
95
-
96
-
97
-
98
-
99
-
100
-
101
-
102
-
103
-
104
-
105
-
106
-
107
-
108
-
109
-
110
-
111
-
112
-
113
-
114
-
115
-
116
-
117
-
118
-
119
-
120
-
121
-
122
-
123
-
 124
124 -
 125
125 -
 126
126 -
 127
127 -
 128
128 -
 129
129 -
 130
130 -
 131
131 -
 132
132 -
 133
133 -
 134
134 -
 135
135 -
 136
136 -
 137
137 -
 138
138 -
 139
139 -
 140
140 -
 141
141 -
 142
142 -
 143
143 -
 144
144 -
145
-
146
-
147
-
148
-
149
-
150
-
151
-
152
-
153
-
154
-
155
-
156
-
157
-
158
-
159
-
160
-
161
-
162
-
163
-
164
-
165
-
166
-
167
-
168
-
169
-
170
-
171
-
172
-
173
-
174
-
175
-
176
-
177
-
178
-
179
-
180
-
181
-
182
-
183
-
184
-
185
-
186
-
187
-
188
-
189
-
190
-
191
-
192
-
193
-
194
-
195
-
196
-
197
-
198
-
199
-
200
-
201
-
202
-
203
-
204
-
205
-
206
-
207
-
208
-
209
-
210
-
211
-
212
-
213
-
214
-
215
-
216
-
217
-
218
-
219
-
220
-
221
-
222
-
223
-
224
-
225
-
226
 |
 |

CAPITAL ONE FINANCIAL CORPORATION
NOTES TO CONSOLIDATED STATEMENTS
114
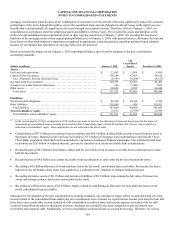
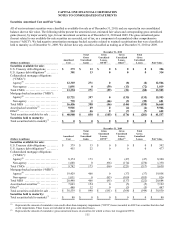
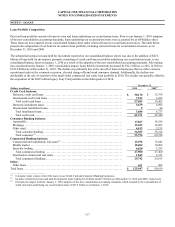
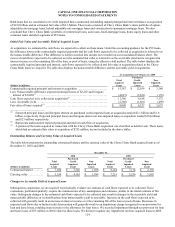
Because borrowers may have the right to call or prepay certain obligations, the expected maturities of our securities are likely to differ
from the scheduled contractual maturities presented above. The table below summarizes, by major security type, the expected
maturities and the weighted average yields of our investment securities as of December 31, 2010. Actual calls or prepayment rates
may differ from our estimates, which may cause the actual maturities of our investment securities to differ from the expected
maturities presented below.
December 31, 2010
Due in 1 Year
or Less
Due > 1 Year
through
5 Years
Due > 5 Years
through
10 Years Due > 10 Years Total
(Dollars in millions) Amount
Average
Yield(1) Amount
Average
Yield(1) Amount
Average
Yield(1) Amount
Average
Yield(1) Amount
Average
Yield(1)
Fair value of securities
available for sale:
U.S. Treasury debt obligations ... $ 260 1.55% $ 126 4.27% $ 0 0% $ 0 0% $ 386 2.39%
U.S. Agency debt obligations(2) .. 172 4.62 142 4.56 0 0 0 0 314 4.59
CMOs:
Agency(3) .................... 600 5.53 6,108 4.59 5,830 4.25 28 4.35 12,566 4.47
Non-agency .................. 148 5.85 741 5.59 125 5.31 5 6.58 1,019 5.60
Total CMOs .................... 748 5.60 6,849 4.71 5,955 4.27 33 4.65 13,585 4.57
MBS:
Agency(3) .................... 54 5.06 3,722 5.02 11,067 4.41 1,140 4.24 15,983 4.54
Non-agency .................. 0 0 385 5.88 296 6.03 0 0 681 5.95
Total MBS ..................... 54 5.06 4,107 5.11 11,363 4.46 1,140 4.24 16,664 4.60
Asset-backed securities ......... 2,131 2.89 7,478 2.64 357 3.66 0 0 9,966 2.73
Other(4) ........................ 326 1.78 89 4.12 6 4.51 201 4.55 622 2.21
Total securities available for sale $ 3,691 3.35% $18,791 3.96% $17,681 4.38% $1,374 4.28% $41,537 4.09%
Amortized cost of securities
available for sale ............. $ 3,666 $18,463 $17,511 $1,348 $40,988
________________________
(1) The weighted-average yield is computed using the expected maturity of each security weighted based on the amortized cost of each security.
(2) Consists of debt securities issued by Fannie Mae and Freddie Mac.
(3) Consists of mortgage-related securities issued by Fannie Mae, Freddie Mac and Ginnie Mae.
(4) Yields of tax-exempt securities are calculated on a fully taxable-equivalent (FTE) basis.
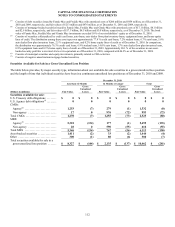
Credit Ratings
Approximately 92% and 90% of our total investment securities portfolio was rated AAA or its equivalent as of December 31, 2010
and 2009, respectively, while approximately 4% and 5%, respectively, were below investment grade as of December 31, 2010 and
2009. All of our agency securities were rated AAA as of December 31, 2010 and 2009. The table below presents information on the
credit ratings of our non-agency CMOs, non-agency MBS and asset-backed securities, which account for the substantial majority of
the unrealized losses related to our investment securities portfolio as of December 31, 2010 and 2009.
December 31,
2010 2009
% o
f
Investment
Securities
Portfolio(1) AAA
Other
Investment
Grade
Below
Investment
Grade or
Not Rated
%o
f
Investment
Securities
Portfolio(1) AAA
Other
Investment
Grade
Below
Investment
Grade or
Not Rated
N
on-agency CMOs ......... 3% 1% 11% 88% 4% 2% 24% 74%
N
on-agency MBS .......... 2 0 6 94 3 4 7 89
Asset-backed securities ..... 24 90 10 0 18 84 16 0
________________________
(1) Calculated based on the amortized cost of the major security type presented divided by the amortized cost of our total investment securities
portfolio as of the end of each period.