Capital One 2010 Annual Report Download - page 20
Download and view the complete annual report
Please find page 20 of the 2010 Capital One annual report below. You can navigate through the pages in the report by either clicking on the pages listed below, or by using the keyword search tool below to find specific information within the annual report.
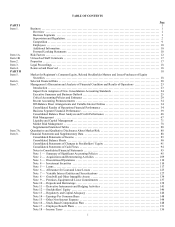
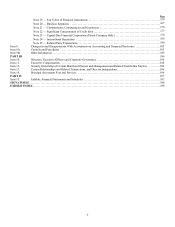
iii
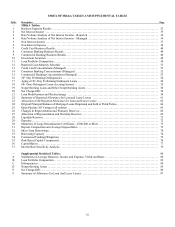
INDEX OF MD&A TABLES AND SUPPLEMENTAL TABLES
Table Description Page
— MD&A Tables:
1 Business Segment Results ..................................................................................... 23
2
N
et Interest Income ........................................................................................... 35
3 Rate/Volume Analysis of Net Interest Income—Reported ........................................................ 36
4 Rate/Volume Analysis of Net Interest Income—Managed ........................................................ 36
5
N
on-Interest Income ........................................................................................... 37
6
N
on-Interest Expense .......................................................................................... 38
7 Credit Card Business Results ................................................................................... 40
8 Consumer Banking Business Results ............................................................................ 44
9 Commercial Banking Business Results .......................................................................... 46
10 Investment Securities .......................................................................................... 49
11 Loan Portfolio Composition .................................................................................... 50
12 Reported Loan Maturity Schedule .............................................................................. 51
13 Credit Card Concentrations (Managed) .......................................................................... 51
14 Consumer Banking Concentrations (Managed) .................................................................. 52
15 Commercial Banking Concentrations (Managed) ................................................................. 53
16 30+ Day Performing Delinquencies ............................................................................. 54
17 Aging of 30+ Day Performing Delinquent Loans ................................................................. 54
18 90+ Days Delinquent Loans Accruing Interest ................................................................... 55
19
N
onperforming Loans and Other Nonperforming Assets .......................................................... 56
20
N
et Charge-Offs .............................................................................................. 58
21 Loan Modifications and Restructurings ......................................................................... 59
22 Summary of Reported Allowance for Loan and Lease Losses ..................................................... 61
23 Allocation of the Reported Allowance for Loan and Lease Losses ................................................. 62
24 Original Principal Balance of Mortgage Loans Originated and Sold to Third Parties ................................. 64
25 Open Pipeline All Vintages (all entities) ......................................................................... 65
26 Changes in Representation and Warranty Reserves ............................................................... 66
27 Allocation of Representation and Warranty Reserves ............................................................. 66
28 Liquidity Reserves ............................................................................................ 72
29 Deposits ...................................................................................................... 72
30 Maturities of Large Denomination Certificates—$100,000 or More ................................................ 73
31 Deposit Composition and Average Deposit Rates ................................................................ 73
32 Short Term Borrowings ........................................................................................ 74
33 Borrowing Capacity ........................................................................................... 74
34 Contractual Funding Obligations ............................................................................... 75
35 Risk-Based Capital Components ................................................................................ 76
36 Capital Ratios ................................................................................................. 77
37 Interest Rate Sensitivity Analysis ............................................................................... 79
— Supplemental Statistical Tables: 80
A Statements of Average Balances, Income and Expense, Yields and Rates .......................................... 80
B Loan Portfolio Composition .................................................................................... 82
C Delinquencies ................................................................................................. 84
D
N
onperforming Assets ......................................................................................... 85
E
N
et Charge-Offs .............................................................................................. 86
F Summary of Allowance for Loan And Lease Losses .............................................................. 87


