Capital One 2010 Annual Report Download - page 185
Download and view the complete annual report
Please find page 185 of the 2010 Capital One annual report below. You can navigate through the pages in the report by either clicking on the pages listed below, or by using the keyword search tool below to find specific information within the annual report.-
 1
1 -
2
-
3
-
4
-
5
-
6
-
7
-
8
-
9
-
10
-
11
-
12
-
13
-
14
-
15
-
16
-
17
-
18
-
19
-
20
-
21
-
22
-
23
-
24
-
25
-
26
-
27
-
28
-
29
-
30
-
31
-
32
-
33
-
34
-
35
-
36
-
37
-
38
-
39
-
40
-
41
-
42
-
43
-
44
-
45
-
46
-
47
-
48
-
49
-
50
-
51
-
52
-
53
-
54
-
55
-
56
-
57
-
58
-
59
-
60
-
61
-
62
-
63
-
64
-
65
-
66
-
67
-
68
-
69
-
70
-
71
-
72
-
73
-
74
-
75
-
76
-
77
-
78
-
79
-
80
-
81
-
82
-
83
-
84
-
85
-
86
-
87
-
88
-
89
-
90
-
91
-
92
-
93
-
94
-
95
-
96
-
97
-
98
-
99
-
100
-
101
-
102
-
103
-
104
-
105
-
106
-
107
-
108
-
109
-
110
-
111
-
112
-
113
-
114
-
115
-
116
-
117
-
118
-
119
-
120
-
121
-
122
-
123
-
124
-
125
-
126
-
127
-
128
-
129
-
130
-
131
-
132
-
133
-
134
-
135
-
136
-
137
-
138
-
139
-
140
-
141
-
142
-
143
-
144
-
145
-
146
-
147
-
148
-
149
-
150
-
151
-
152
-
153
-
154
-
155
-
156
-
157
-
158
-
159
-
160
-
161
-
162
-
163
-
164
-
165
-
166
-
167
-
168
-
169
-
170
-
171
-
172
-
173
-
174
-
 175
175 -
 176
176 -
 177
177 -
 178
178 -
 179
179 -
 180
180 -
 181
181 -
 182
182 -
 183
183 -
 184
184 -
 185
185 -
 186
186 -
 187
187 -
 188
188 -
 189
189 -
 190
190 -
 191
191 -
 192
192 -
 193
193 -
 194
194 -
 195
195 -
196
-
197
-
198
-
199
-
200
-
201
-
202
-
203
-
204
-
205
-
206
-
207
-
208
-
209
-
210
-
211
-
212
-
213
-
214
-
215
-
216
-
217
-
218
-
219
-
220
-
221
-
222
-
223
-
224
-
225
-
226
 |
 |
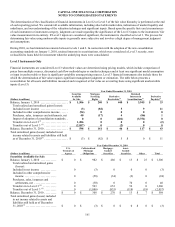
CAPITAL ONE FINANCIAL CORPORATION
NOTES TO CONSOLIDATED STATEMENTS
165
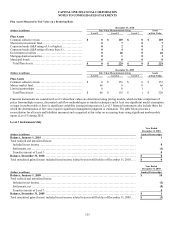
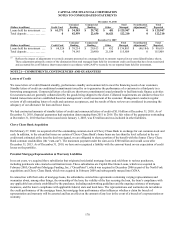
Loans Held For Sale
Loans held for sale are carried at the lower of aggregate cost, net of deferred fees, deferred origination costs and effects of hedge
accounting, or fair value. The fair value of loans held for sale is determined using current secondary market prices for portfolios with
similar characteristics. The carrying amounts as of December 31, 2010 and 2009 approximate fair value.
Loans Held For Investment, Net
The fair values of credit card loans, installment loans, auto loans, home loans and commercial loans were estimated using a discounted
cash flow method, a form of the income approach. Discount rates were determined considering rates at which similar portfolios of
loans would be made under current conditions and considering liquidity spreads applicable to each loan portfolio based on the
secondary market. The fair value of credit card loans excluded any value related to customer account relationships. The increase in fair
value above carrying amount at December 31, 2010 was primarily due to a tightening of liquidity spreads and improved credit
performance noted in our credit card, auto and commercial loan portfolios.
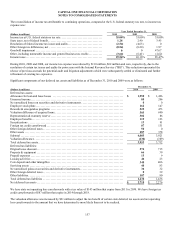
Commercial loans are considered impaired when it is probable that all amounts due in accordance with the contractual terms will not
be collected. From time to time, we record nonrecurring fair value adjustments to reflect the fair value of the loan’s collateral. See
table of assets and liabilities measured at fair value on a nonrecurring basis above.
Interest Receivable
The carrying amount of interest receivable approximates the fair value of this asset due to its relatively short-term nature.
Accounts Receivable from Securitizations
Accounts receivable from securitizations include the interest-only strip, retained notes accrued interest receivable, cash reserve
accounts and cash spread accounts for those securitization structures achieving off-balance sheet treatment. Refer to “Note 7—
Variable Interest Entities and Securitizations” for discussion regarding the adoption of the new accounting consolidation standards on
January 1, 2010. We use a valuation model that calculates the present value of estimated future cash flows. The model incorporates
our estimate of assumptions market participants use in determining fair value, including estimates of payment rates, defaults, and
discount rates including adjustments for liquidity, and contractual interest and fees. Other retained interests related to securitizations
are carried at cost, which approximates fair value. The valuation technique for these securities is discussed in more detail in “Note 7—
Variable Interest Entities and Securitizations.”
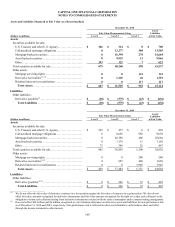
Derivative Assets
Most of our derivatives are not exchange traded, but instead traded in over the counter markets where quoted market prices are not
readily available. The fair value derived for those derivatives using models that use primarily market observable inputs, such as
interest rate yield curves, credit curves, option volatility and currency rates are classified as Level 2. Any derivative fair value
measurements using significant assumptions that are unobservable are classified as Level 3, which include interest rate swaps whose
remaining terms do not correlate with market observable interest rate yield curves. The impact of counterparty non-performance risk is
considered when measuring the fair value of derivative assets. These derivatives are included in other assets on the balance sheet.
We validate the pricing obtained from the internal models through comparison of pricing to additional sources, including external
valuation agents and other internal sources. Pricing variances among different pricing sources are analyzed and validated.
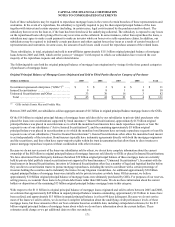
Mortgage Servicing Rights
MSRs do not trade in an active market with readily observable prices. Accordingly, we determine the fair value of MSRs using a
valuation model that calculates the present value of estimated future net servicing income. The model incorporates assumptions that
market participants use in estimating future net servicing income, including estimates of prepayment spreads, discount rate, cost to
service, contractual servicing fee income, ancillary income and late fees. We record MSRs at fair value on a recurring basis. Fair value
measurements of MSRs use significant unobservable inputs and, accordingly, are classified as Level 3. The valuation technique for
these securities is discussed in more detail in “Note 8—Goodwill and Other Intangible Assets.”