Capital One 2010 Annual Report Download - page 183
Download and view the complete annual report
Please find page 183 of the 2010 Capital One annual report below. You can navigate through the pages in the report by either clicking on the pages listed below, or by using the keyword search tool below to find specific information within the annual report.-
 1
1 -
2
-
3
-
4
-
5
-
6
-
7
-
8
-
9
-
10
-
11
-
12
-
13
-
14
-
15
-
16
-
17
-
18
-
19
-
20
-
21
-
22
-
23
-
24
-
25
-
26
-
27
-
28
-
29
-
30
-
31
-
32
-
33
-
34
-
35
-
36
-
37
-
38
-
39
-
40
-
41
-
42
-
43
-
44
-
45
-
46
-
47
-
48
-
49
-
50
-
51
-
52
-
53
-
54
-
55
-
56
-
57
-
58
-
59
-
60
-
61
-
62
-
63
-
64
-
65
-
66
-
67
-
68
-
69
-
70
-
71
-
72
-
73
-
74
-
75
-
76
-
77
-
78
-
79
-
80
-
81
-
82
-
83
-
84
-
85
-
86
-
87
-
88
-
89
-
90
-
91
-
92
-
93
-
94
-
95
-
96
-
97
-
98
-
99
-
100
-
101
-
102
-
103
-
104
-
105
-
106
-
107
-
108
-
109
-
110
-
111
-
112
-
113
-
114
-
115
-
116
-
117
-
118
-
119
-
120
-
121
-
122
-
123
-
124
-
125
-
126
-
127
-
128
-
129
-
130
-
131
-
132
-
133
-
134
-
135
-
136
-
137
-
138
-
139
-
140
-
141
-
142
-
143
-
144
-
145
-
146
-
147
-
148
-
149
-
150
-
151
-
152
-
153
-
154
-
155
-
156
-
157
-
158
-
159
-
160
-
161
-
162
-
163
-
164
-
165
-
166
-
167
-
168
-
169
-
170
-
171
-
172
-
 173
173 -
 174
174 -
 175
175 -
 176
176 -
 177
177 -
 178
178 -
 179
179 -
 180
180 -
 181
181 -
 182
182 -
 183
183 -
 184
184 -
 185
185 -
 186
186 -
 187
187 -
 188
188 -
 189
189 -
 190
190 -
 191
191 -
 192
192 -
 193
193 -
194
-
195
-
196
-
197
-
198
-
199
-
200
-
201
-
202
-
203
-
204
-
205
-
206
-
207
-
208
-
209
-
210
-
211
-
212
-
213
-
214
-
215
-
216
-
217
-
218
-
219
-
220
-
221
-
222
-
223
-
224
-
225
-
226
 |
 |

CAPITAL ONE FINANCIAL CORPORATION
NOTES TO CONSOLIDATED STATEMENTS
163
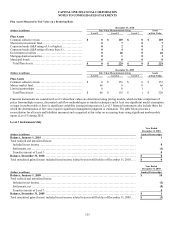
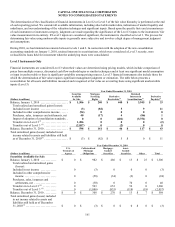
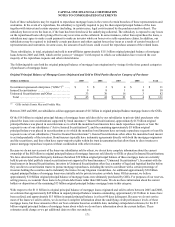
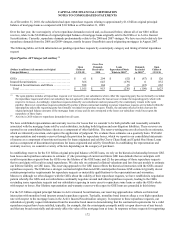
For assets measured at fair value on a nonrecurring basis and still held on the consolidated balance sheet, the following table provides
the fair value measures by level of valuation assumptions used and the gains or losses recognized for these assets as a result of fair
value measurements.
December 31, 2010
Fair Value Measurements Using
Assets at
Fair
Value
Total
Gains/
(Losses)
(Dollars in millions) Level 1 Level 2 Level 3
Assets
Loans held for sale ...........................
.
$ 0 $ 206 $ 0 $ 206 $ (9)
Loans held for investment ....................
.
0 126 159 285 (151)
Foreclosed assets(1) ...........................
.
0 249 0 249 (42)
Other .......................................
.
0 18 0 18 (8)
Total ......................................
.
$ 0 $ 599 $ 159 $ 758 $ (210)
December 31, 2009
Fair Value Measurements Using
Assets at
Fair
Value
Total
Gains/
(Losses)
(Dollars in millions) Level 1 Level 2 Level 3
Assets
Loans held for sale ...........................
.
$ 0 $ 266 $ 0 $ 266 $ 16
Loans held for investment ....................
.
0 156 267 423 255
Foreclosed assets(1) ...........................
.
0 197 0 197 26
Other .......................................
.
0 31 0 31 (4)
Total ......................................
.
$ 0 $ 650 $ 267 $ 917 $ 293
________________________
(1) Represents the fair value and related losses of foreclosed properties that were written down subsequent to their initial classification as foreclosed
properties.
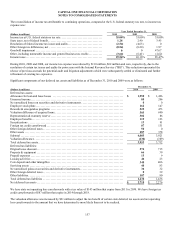
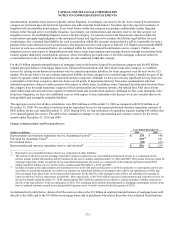
Fair Value of Financial Instruments
The following reflects the fair value of financial instruments, whether or not recognized on the consolidated balance sheet, at fair value.
December 31,
2010 2009
(Dollars in millions)
Carrying
Amount
Estimated
Fair Value
Carrying
Amount (1)
Estimated
Fair Value(1)
Financial Assets
Cash and cash equivalents .....................................
.
$ 5,249 $ 5,249 $ 8,685 $ 8,685
Restricted cash for securitization investors ......................
.
1,602 1,602 501 501
Securities available for sale ....................................
.
41,537 41,537 38,830 38,830
Securities held to maturity .....................................
.
0 0 80 80
Loans held for sale ............................................
.
228 228 268 268
N
et loans held for investment ..................................
.
120,319 124,117 86,492 86,158
Interest receivable .............................................
.
1,070 1,070 936 936
Accounts receivable from securitization .........................
.
118 118 7,128 7,128
Derivatives ...................................................
.
1,319 1,319 1,069 1,069
Mortgage servicing rights ......................................
.
141 141 240 240
Financial Liabilities
N
on-interest bearing deposits ..................................
.
$ 15,048 $ 15,048 $ 13,439 $ 13,439
Interest-bearing deposits .......................................
.
107,162 107,587 102,370 102,616
Senior and subordinated notes ..................................
.
8,650 9,236 9,045 9,156
Securitized debt obligations ....................................
.
26,915 26,943 3,954 3,890
Federal funds purchased and securities loaned or sold under
agreements to repurchase ....................................
.
1,517 1,517 1,140 1,140
Other borrowings .............................................
.
4,714 4,901 6,875 6,693
Interest payable ...............................................
.
488 488 509 509
Derivatives ...................................................
.
636 636 407 407
________________________
(1) Certain prior period amounts have been revised to conform to current presentation.