Capital One 2010 Annual Report Download - page 154
Download and view the complete annual report
Please find page 154 of the 2010 Capital One annual report below. You can navigate through the pages in the report by either clicking on the pages listed below, or by using the keyword search tool below to find specific information within the annual report.-
 1
1 -
2
-
3
-
4
-
5
-
6
-
7
-
8
-
9
-
10
-
11
-
12
-
13
-
14
-
15
-
16
-
17
-
18
-
19
-
20
-
21
-
22
-
23
-
24
-
25
-
26
-
27
-
28
-
29
-
30
-
31
-
32
-
33
-
34
-
35
-
36
-
37
-
38
-
39
-
40
-
41
-
42
-
43
-
44
-
45
-
46
-
47
-
48
-
49
-
50
-
51
-
52
-
53
-
54
-
55
-
56
-
57
-
58
-
59
-
60
-
61
-
62
-
63
-
64
-
65
-
66
-
67
-
68
-
69
-
70
-
71
-
72
-
73
-
74
-
75
-
76
-
77
-
78
-
79
-
80
-
81
-
82
-
83
-
84
-
85
-
86
-
87
-
88
-
89
-
90
-
91
-
92
-
93
-
94
-
95
-
96
-
97
-
98
-
99
-
100
-
101
-
102
-
103
-
104
-
105
-
106
-
107
-
108
-
109
-
110
-
111
-
112
-
113
-
114
-
115
-
116
-
117
-
118
-
119
-
120
-
121
-
122
-
123
-
124
-
125
-
126
-
127
-
128
-
129
-
130
-
131
-
132
-
133
-
134
-
135
-
136
-
137
-
138
-
139
-
140
-
141
-
142
-
143
-
 144
144 -
 145
145 -
 146
146 -
 147
147 -
 148
148 -
 149
149 -
 150
150 -
 151
151 -
 152
152 -
 153
153 -
 154
154 -
 155
155 -
 156
156 -
 157
157 -
 158
158 -
 159
159 -
 160
160 -
 161
161 -
 162
162 -
 163
163 -
 164
164 -
165
-
166
-
167
-
168
-
169
-
170
-
171
-
172
-
173
-
174
-
175
-
176
-
177
-
178
-
179
-
180
-
181
-
182
-
183
-
184
-
185
-
186
-
187
-
188
-
189
-
190
-
191
-
192
-
193
-
194
-
195
-
196
-
197
-
198
-
199
-
200
-
201
-
202
-
203
-
204
-
205
-
206
-
207
-
208
-
209
-
210
-
211
-
212
-
213
-
214
-
215
-
216
-
217
-
218
-
219
-
220
-
221
-
222
-
223
-
224
-
225
-
226
 |
 |

CAPITAL ONE FINANCIAL CORPORATION
NOTES TO CONSOLIDATED STATEMENTS
134
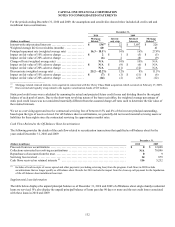
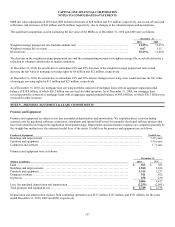
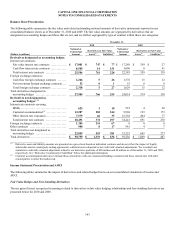
NOTE 8—GOODWILL AND OTHER INTANGIBLE ASSETS
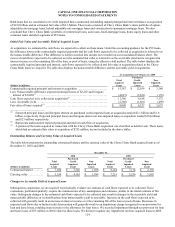
The table below displays the components of goodwill and other intangible assets, including mortgage servicing rights, as of December
31, 2010 and 2009:
December 31,
(Dollars in millions) 2010 2009
Goodwill ................................................................................................. $ 13,591 $ 13,596
Other intangible assets:
Core deposit intangibles ................................................................................ 650 849
Lease intangibles ...................................................................................... 26 31
Purchased credit card relationship intangible(1) ........................................................ 42 0
Trust intangibles ....................................................................................... 6 6
Other intangibles ...................................................................................... 9 20
Total other intangible assets ............................................................................. 733 906
Total goodwill and other intangible assets . . . . . . . . . . . . . . . . . . . . . . . . . . . . . . . . . . . . . . . . . . . . . . . . . . . . . . . . . . . . . . . $ 14,324 $ 14,502
Mortgage servicing rights ................................................................................ $ 141 $ 240
________________________
(1) Relates to the acquisition of the legacy Sony Card portfolio in the third quarter of 2010.
Goodwill
During the first quarter of 2009, we acquired Chevy Chase Bank, the largest retail branch presence in the Washington, D.C. region,
which created $1.6 billion of goodwill. During 2009, we realigned our business segment reporting structure to better reflect the
manner in which the performance of our operations is evaluated. We now report the results of our business through three operating
segments: Credit Card which consist of Domestic Card and International Card; Consumer Banking which consist of Auto Finance,
Home Loans and Other Retail; and Commercial Banking which consist of Commercial and Multifamily Real Estate, Middle Market,
Specialty Lending and Small-ticket Commercial Real Estate. As a result of the segment reorganization, goodwill was reassigned to the
new reporting units using a relative fair value allocation approach, and the goodwill associated with the Chevy Chase Bank acquisition
was assigned to the Commercial Banking and Consumer Banking segments. Prior to the segment reorganization in 2009, goodwill
associated with the acquisition was included in the Other category. See “Note 2—Acquisitions and Restructuring Activities” for
information regarding the Chevy Chase Bank acquisition.
In accordance with accounting guidance, goodwill is not amortized but is tested for impairment at the reporting unit level, which is at
the operating segment level or one level below an operating segment. Impairment is the condition that exists when the carrying
amount of goodwill exceeds its implied fair value. Goodwill is required to be tested for impairment annually and between annual tests
if events or circumstances change, such as adverse changes in the business climate, that would more likely than not reduce the fair
value of the reporting unit below its carrying value. Goodwill is assigned to one or more reporting units at the date of acquisition. Our
reporting units are Domestic Card, International Card, Auto Finance, other Consumer Banking and Commercial Banking. The
goodwill impairment test, performed at October 1 of each year, is a two-step test. The first step identifies whether there is potential
impairment by comparing the fair value of a reporting unit to the carrying amount, including goodwill. If the fair value of a reporting
unit is less than its carrying amount, the second step of the impairment test is required to measure the amount of any impairment loss.
For the 2010 annual impairment test, the fair value of reporting units was calculated using a discounted cash flow analysis, a form of
the income approach, using each reporting unit’s internal forecast and a terminal value calculated using a growth rate reflecting the
nominal growth rate of the economy as a whole and appropriate discount rates for the respective reporting units. Cash flows were
adjusted as necessary in order to maintain each reporting unit’s equity capital requirements. Our discounted cash flow analysis
required management to make judgments about future loan and deposit growth, revenue growth, credit losses, and capital rates. The
cash flows were discounted to present value using reporting unit specific discount rates that are largely based on our external cost of
equity with adjustments for risk inherent in each reporting unit. Discount rates used for the reporting units ranged from 10.0% to
14.6%. The key inputs into the discounted cash flow analysis were corroborated with market data, where available, indicating that
assumptions used were within a reasonable range of observable market data.