Capital One 2010 Annual Report Download - page 92
Download and view the complete annual report
Please find page 92 of the 2010 Capital One annual report below. You can navigate through the pages in the report by either clicking on the pages listed below, or by using the keyword search tool below to find specific information within the annual report.-
 1
1 -
2
-
3
-
4
-
5
-
6
-
7
-
8
-
9
-
10
-
11
-
12
-
13
-
14
-
15
-
16
-
17
-
18
-
19
-
20
-
21
-
22
-
23
-
24
-
25
-
26
-
27
-
28
-
29
-
30
-
31
-
32
-
33
-
34
-
35
-
36
-
37
-
38
-
39
-
40
-
41
-
42
-
43
-
44
-
45
-
46
-
47
-
48
-
49
-
50
-
51
-
52
-
53
-
54
-
55
-
56
-
57
-
58
-
59
-
60
-
61
-
62
-
63
-
64
-
65
-
66
-
67
-
68
-
69
-
70
-
71
-
72
-
73
-
74
-
75
-
76
-
77
-
78
-
79
-
80
-
81
-
 82
82 -
 83
83 -
 84
84 -
 85
85 -
 86
86 -
 87
87 -
 88
88 -
 89
89 -
 90
90 -
 91
91 -
 92
92 -
 93
93 -
 94
94 -
 95
95 -
 96
96 -
 97
97 -
 98
98 -
 99
99 -
 100
100 -
 101
101 -
 102
102 -
103
-
104
-
105
-
106
-
107
-
108
-
109
-
110
-
111
-
112
-
113
-
114
-
115
-
116
-
117
-
118
-
119
-
120
-
121
-
122
-
123
-
124
-
125
-
126
-
127
-
128
-
129
-
130
-
131
-
132
-
133
-
134
-
135
-
136
-
137
-
138
-
139
-
140
-
141
-
142
-
143
-
144
-
145
-
146
-
147
-
148
-
149
-
150
-
151
-
152
-
153
-
154
-
155
-
156
-
157
-
158
-
159
-
160
-
161
-
162
-
163
-
164
-
165
-
166
-
167
-
168
-
169
-
170
-
171
-
172
-
173
-
174
-
175
-
176
-
177
-
178
-
179
-
180
-
181
-
182
-
183
-
184
-
185
-
186
-
187
-
188
-
189
-
190
-
191
-
192
-
193
-
194
-
195
-
196
-
197
-
198
-
199
-
200
-
201
-
202
-
203
-
204
-
205
-
206
-
207
-
208
-
209
-
210
-
211
-
212
-
213
-
214
-
215
-
216
-
217
-
218
-
219
-
220
-
221
-
222
-
223
-
224
-
225
-
226
 |
 |

72
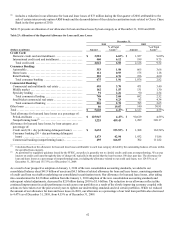
Table 28: Liquidity Reserves
December 31,
(Dollars in millions) 2010 2009
Cash and cash equivalents ................................................................ $ 5,249 $ 8,685
Securities available for sale(1) ............................................................. 41,537 38,830
Less: Pledged available for sale securities ................................................ (9,963) (11,883)
Unencumbered available-for-sale securities ................................................ 31,574 26,947
Undrawn committed securitization borrowing facilities ..................................... 207 2,913
Total liquidity reserves ................................................................... $ 37,030 $ 38,545
________________________
(1) The weighted average life of our available-for-sale securities was approximately 5.1 and 4.9 years as of December 31, 2010 and 2009,
respectively.
Funding
Our funding objective is to establish an appropriate maturity profile using a cost-effective mix of both short-term and long-term funds.
We use a variety of funding sources, including deposits, loan securitizations, debt and equity securities, securitization borrowing
facilities and FHLB advances.
Deposits
Our deposits provide a stable and relatively low cost of funds and have become our largest source of funding. We have expanded our
opportunities for deposit growth through direct and indirect marketing channels, our existing branch network and branch expansion.
These channels offer a broad set of deposit products that include demand deposits, money market deposits, negotiable order of
withdrawal (“NOW”) accounts, savings accounts and certificates of deposit. Table 29 presents the composition of our deposits by type
as of December 31, 2010 and 2009. Total deposits increased by $6.4 billion, or 5.5%, in 2010, to $122.2 billion as of December 31,
2010.
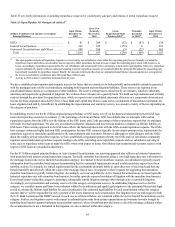
Table 29: Deposits
December 31,
(Dollars in millions) 2010 2009
N
on-interest bearing ...................................................................... $ 15,048 $ 13,439
N
OW accounts .......................................................................... 13,536 12,077
Money market deposit accounts ........................................................... 44,485 38,094
Savings accounts ......................................................................... 26,077 17,019
Other consumer time deposits ............................................................. 15,753 25,456
Total core deposits ..................................................................... 114,899 106,085
Public fund certificates of deposit $100,000 or more ........................................ 177 579
Certificates of deposit $100,000 or more ................................................... 6,300 8,248
Foreign time deposits ..................................................................... 834 897
Total deposits .......................................................................... $ 122,210 $ 115,809
Of our total deposits, approximately $834 million and $897 million were held in foreign banking offices as of December 31, 2010 and
2009, respectively. Large domestic denomination certificates of deposits of $100,000 or more represented $6.5 billion and $8.8 billion
of our total deposits as of December 31, 2010 and 2009, respectively. Our funding and liquidity strategy takes into consideration the
scheduled maturities of large denomination time deposits. Of the $6.5 billion in large domestic denomination certificates of deposit as
of December 31, 2010, $0.7 billion is scheduled to mature within the next three months; $2.3 billion is scheduled to mature between
three and 12 months and $3.5 billion is scheduled to mature over 12 months. Based on past activity, we expect to retain a portion of
these deposits as they mature.
We have brokered deposits, which we obtained through the use of third-party intermediaries that are included above in Table 28 in
money market deposit accounts and other consumer time deposits. The Federal Deposit Insurance Corporation Improvement Act of
1991 limits the use of brokered deposits to “well-capitalized” insured depository institutions and, with a waiver from the Federal
Deposit Insurance Corporation, to “adequately capitalized” institutions. COBNA and CONA were “well-capitalized,” as defined under
the federal banking regulatory guidelines, as of December 31, 2010, and therefore permitted to maintain brokered deposits. Our
brokered deposits totaled $14.8 billion, or 12% of total deposits, as of December 31, 2010. Brokered deposits totaled $18.8 billion, or
16% of total deposits, as of December 31, 2009. Based on our historical access to the brokered deposit market, we expect to replace
maturing brokered deposits with new brokered deposits or direct deposits and branch deposits.