Capital One 2010 Annual Report Download - page 50
Download and view the complete annual report
Please find page 50 of the 2010 Capital One annual report below. You can navigate through the pages in the report by either clicking on the pages listed below, or by using the keyword search tool below to find specific information within the annual report.-
 1
1 -
2
-
3
-
4
-
5
-
6
-
7
-
8
-
9
-
10
-
11
-
12
-
13
-
14
-
15
-
16
-
17
-
18
-
19
-
20
-
21
-
22
-
23
-
24
-
25
-
26
-
27
-
28
-
29
-
30
-
31
-
32
-
33
-
34
-
35
-
36
-
37
-
38
-
39
-
 40
40 -
 41
41 -
 42
42 -
 43
43 -
 44
44 -
 45
45 -
 46
46 -
 47
47 -
 48
48 -
 49
49 -
 50
50 -
 51
51 -
 52
52 -
 53
53 -
 54
54 -
 55
55 -
 56
56 -
 57
57 -
 58
58 -
 59
59 -
 60
60 -
61
-
62
-
63
-
64
-
65
-
66
-
67
-
68
-
69
-
70
-
71
-
72
-
73
-
74
-
75
-
76
-
77
-
78
-
79
-
80
-
81
-
82
-
83
-
84
-
85
-
86
-
87
-
88
-
89
-
90
-
91
-
92
-
93
-
94
-
95
-
96
-
97
-
98
-
99
-
100
-
101
-
102
-
103
-
104
-
105
-
106
-
107
-
108
-
109
-
110
-
111
-
112
-
113
-
114
-
115
-
116
-
117
-
118
-
119
-
120
-
121
-
122
-
123
-
124
-
125
-
126
-
127
-
128
-
129
-
130
-
131
-
132
-
133
-
134
-
135
-
136
-
137
-
138
-
139
-
140
-
141
-
142
-
143
-
144
-
145
-
146
-
147
-
148
-
149
-
150
-
151
-
152
-
153
-
154
-
155
-
156
-
157
-
158
-
159
-
160
-
161
-
162
-
163
-
164
-
165
-
166
-
167
-
168
-
169
-
170
-
171
-
172
-
173
-
174
-
175
-
176
-
177
-
178
-
179
-
180
-
181
-
182
-
183
-
184
-
185
-
186
-
187
-
188
-
189
-
190
-
191
-
192
-
193
-
194
-
195
-
196
-
197
-
198
-
199
-
200
-
201
-
202
-
203
-
204
-
205
-
206
-
207
-
208
-
209
-
210
-
211
-
212
-
213
-
214
-
215
-
216
-
217
-
218
-
219
-
220
-
221
-
222
-
223
-
224
-
225
-
226
 |
 |
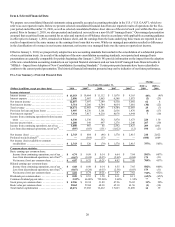
30
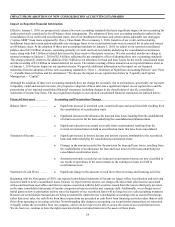
appropriate to adjust price quotes received. When significant adjustments are required to price quotes or inputs, it may be appropriate
to utilize an estimate based primarily on unobservable inputs.
Significant judgment may be required to determine whether certain financial instruments measured at fair value are included in
Level 2 or Level 3. In making this determination, we consider all available information that market participants use to measure the
fair value of the financial instrument, including observable market data, indications of market liquidity and orderliness, and our
understanding of the valuation techniques and significant inputs used. Based upon the specific facts and circumstances of each
instrument or instrument category, judgments are made regarding the significance of the Level 3 inputs to the instruments’ fair
value measurement in its entirety. If Level 3 inputs are considered significant, the instrument is classified as Level 3. The process
for determining fair value using unobservable inputs is generally more subjective and involves a high degree of management
judgment and assumptions.
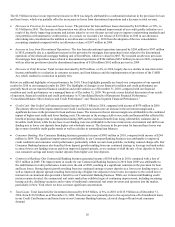
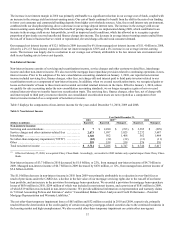
Our financial instruments recorded at fair value on a recurring basis represented approximately 22% of our total reported assets of
$197.5 billion as of December 31, 2010, compared with 26% of our total reported assets of $169.6 billion as of December 31,
2009. Financial assets for which the fair value was determined using significant Level 3 inputs represented approximately 2% of these
financial instruments (1% of total assets) as of December 31, 2010, and approximately 14% of these financial instruments (4% of total
assets) as of December 31, 2009. The decreases in the percentage of financial instruments measured at a fair value on a recurring basis
and in the percentage of financial instruments measured using Level 3 inputs were primarily attributable to the increase in our assets
from the adoption of the new consolidation accounting standards, as the consolidated loans are generally classified as held for
investment and are therefore not measured at fair value on a recurring basis.
We discuss changes in the valuation inputs and assumptions used in determining the fair value of our financial instruments, including
the extent to which we have relied on significant unobservable inputs to estimate fair value and our process for corroborating these
inputs, in “Note 19—Fair Value of Financial Instruments.”
Allowance for Loan and Lease Losses
Our allowance for loan and lease losses provides for probable credit losses inherent in our loan portfolio as of each balance sheet date.
We have an established process, using analytical tools, benchmarks and management judgment, to determine our allowance for loan
and lease losses. We calculate the allowance for loan and lease losses by estimating probable losses separately for segments of our
loan portfolio with similar risk characteristics.
We generally review and assess our allowance methodologies and adequacy of the allowance for loan and lease losses on a quarterly
basis. Our assessment involves evaluating many factors including, but not limited to, historical loss experience, recent trends in
delinquencies and charge-offs, risk ratings, the impact of bankruptcy filings, deceased and recovered amounts, the value of collateral
underlying secured loans, account seasoning, changes in our credit evaluation, underwriting and collection management policies,
seasonality, general economic conditions, changes in the legal and regulatory environment and uncertainties in forecasting and
modeling techniques used in estimating our allowance for loan and lease losses. Key factors that have a significant impact on our
allowance for loan and lease losses include assumptions about unemployment rates, home prices, and the valuation of commercial
properties, consumer real estate, and automobiles.
Although we examine a variety of externally available data, as well as our internal loan performance data, to determine our
allowance for loan and lease losses, our estimation process is subject to risks and uncertainties, including a reliance on historical
loss and trend information that may not be representative of current conditions and indicative of future performance. Accordingly,
our actual credit loss experience may not be in line with our expectations. For example, as a result of improving credit performance
trends during 2010, charge-offs began to decrease and we recorded a significant allowance release of $2.8 billion. We provide
additional information on the methodologies and key assumptions used in determining our allowance for loan and lease losses for
each of our loan portfolio segments in “Note 1—Summary of Significant Accounting Policies.” We provide information on the
components of our allowance, disaggregated by impairment methodology, and changes in our allowance in “Note 6—Allowance
for Loan and Lease Losses.”
Asset Impairment
We review other assets for impairment on a regular basis. This process requires significant management judgment and involves
various estimates and assumptions. Our investment securities and goodwill and intangible assets represent a significant portion of our
other assets. Accordingly, below we describe our process for assessing impairment of these assets and the key estimates and
assumptions involved in this process.