Capital One 2010 Annual Report Download - page 55
Download and view the complete annual report
Please find page 55 of the 2010 Capital One annual report below. You can navigate through the pages in the report by either clicking on the pages listed below, or by using the keyword search tool below to find specific information within the annual report.-
 1
1 -
2
-
3
-
4
-
5
-
6
-
7
-
8
-
9
-
10
-
11
-
12
-
13
-
14
-
15
-
16
-
17
-
18
-
19
-
20
-
21
-
22
-
23
-
24
-
25
-
26
-
27
-
28
-
29
-
30
-
31
-
32
-
33
-
34
-
35
-
36
-
37
-
38
-
39
-
40
-
41
-
42
-
43
-
44
-
 45
45 -
 46
46 -
 47
47 -
 48
48 -
 49
49 -
 50
50 -
 51
51 -
 52
52 -
 53
53 -
 54
54 -
 55
55 -
 56
56 -
 57
57 -
 58
58 -
 59
59 -
 60
60 -
 61
61 -
 62
62 -
 63
63 -
 64
64 -
 65
65 -
66
-
67
-
68
-
69
-
70
-
71
-
72
-
73
-
74
-
75
-
76
-
77
-
78
-
79
-
80
-
81
-
82
-
83
-
84
-
85
-
86
-
87
-
88
-
89
-
90
-
91
-
92
-
93
-
94
-
95
-
96
-
97
-
98
-
99
-
100
-
101
-
102
-
103
-
104
-
105
-
106
-
107
-
108
-
109
-
110
-
111
-
112
-
113
-
114
-
115
-
116
-
117
-
118
-
119
-
120
-
121
-
122
-
123
-
124
-
125
-
126
-
127
-
128
-
129
-
130
-
131
-
132
-
133
-
134
-
135
-
136
-
137
-
138
-
139
-
140
-
141
-
142
-
143
-
144
-
145
-
146
-
147
-
148
-
149
-
150
-
151
-
152
-
153
-
154
-
155
-
156
-
157
-
158
-
159
-
160
-
161
-
162
-
163
-
164
-
165
-
166
-
167
-
168
-
169
-
170
-
171
-
172
-
173
-
174
-
175
-
176
-
177
-
178
-
179
-
180
-
181
-
182
-
183
-
184
-
185
-
186
-
187
-
188
-
189
-
190
-
191
-
192
-
193
-
194
-
195
-
196
-
197
-
198
-
199
-
200
-
201
-
202
-
203
-
204
-
205
-
206
-
207
-
208
-
209
-
210
-
211
-
212
-
213
-
214
-
215
-
216
-
217
-
218
-
219
-
220
-
221
-
222
-
223
-
224
-
225
-
226
 |
 |

35
the section below provides a comparative discussion of our reported consolidated results of operations for 2010 and our managed
results for 2009 and 2008. Our net income on a managed basis in 2009 and 2008 is the same as our reported net income; however,
there are differences in the classification of certain amounts in our managed income statement, which we identify in our discussion.
See “Exhibit 99.1” for a reconciliation of our non-GAAP managed based information for periods prior to January 1, 2010 to the most
comparable reported U.S. GAAP information.
Net Interest Income
Net interest income represents the difference between the interest income and applicable fees earned on our interest-earning assets,
which includes loans held for investment and investment securities, and the interest expense on our interest-bearing liabilities, which
includes interest-bearing deposits, senior and subordinated notes, securitized debt and other borrowings. We include in interest income
any past due fees on loans that we deem are collectible. Our net interest margin represents the difference between the yield on our
interest-earning assets and the cost of our interest bearing liabilities, including the impact of non-interest bearing funding. Prior to the
adoption of the new consolidation accounting standards on January 1, 2010, our reported net interest income did not include interest
income from loans in our off-balance sheet securitization trusts or the interest expense on third-party debt issued by these
securitization trusts. Beginning January 1, 2010, servicing fees, finance charges, other fees, net charge-offs and interest paid to third
party investors related to consolidated securitization trusts are included in net interest income.
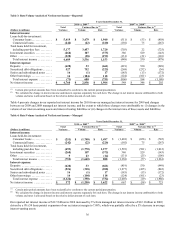
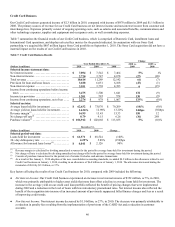
Table 2 below displays the major sources of our interest income and interest expense for 2010, 2009 and 2008. We present for each
major category of our interest-earning assets and interest-bearing liabilities, the average outstanding balances, the interest earned or
paid and the average yield or cost during the period in Table A under “Supplemental Statistical Tables.” We expect net interest income
and our net interest margin to fluctuate based on changes in interest rates and changes in the amount and composition of our interest-
earning assets and interest-bearing liabilities.
Table 2: Net Interest Income
Year Ended December 31,
2010 2009 (1) 2008
(Dollars in millions) Reported Managed Reported Managed Reported Managed
Interest income:
Loans held-for-investment:
Consumer loans(2) ..................... $ 12,656 $ 12,664 $ 7,237 $ 12,915 $ 7,748 $ 14,316
Commercial loans ..................... 1,278 1,278 1,520 1,520 1,712 1,712
Total loans held for investment, including
past-due fees ......................... 13,934 13,942 8,757 14,435 9,460 16,028
Investment securities .................... 1,342 1,342 1,610 1,610 1,224 1,224
Other .................................. 77 77 297 68 428 199
Total interest income .................. 15,353 15,361 10,664 16,113 11,112 17,451
Interest expense:
Deposits ............................... 1,465 1,465 2,093 2,093 2,512 2,512
Securitized debt obligations .............. 809 813 282 1,339 550 2,616
Senior and subordinated notes ............ 276 276 260 260 445 445
Other borrowings ....................... 346 346 332 332 456 456
Total interest expense ................. 2,896 2,900 2,967 4,024 3,963 6,029
N
et interest income ..................... $ 12,457 $ 12,461 $ 7,697 $ 12,089 $ 7,149 $ 11,422
________________________
(1) Effective February 27, 2009, we acquired Chevy Chase Bank. Accordingly, our results for 2009 include only a partial impact from Chevy Chase
Bank.
(2) Interest income on credit card, auto, home and retail banking loans is reflected in consumer loans. Interest income generated from small business
credit cards also is included in consumer loans.
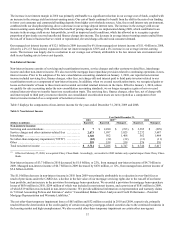
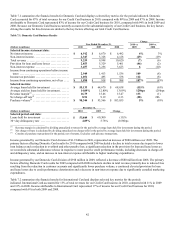
Table 3 presents changes in our reported net interest income between periods and the extent to which those changes were attributable
to: (i) changes in the volume of our interest-earning assets and interest-bearing liabilities or (ii) changes in the interest rates of these
assets and liabilities.