Capital One 2010 Annual Report Download - page 65
Download and view the complete annual report
Please find page 65 of the 2010 Capital One annual report below. You can navigate through the pages in the report by either clicking on the pages listed below, or by using the keyword search tool below to find specific information within the annual report.-
 1
1 -
2
-
3
-
4
-
5
-
6
-
7
-
8
-
9
-
10
-
11
-
12
-
13
-
14
-
15
-
16
-
17
-
18
-
19
-
20
-
21
-
22
-
23
-
24
-
25
-
26
-
27
-
28
-
29
-
30
-
31
-
32
-
33
-
34
-
35
-
36
-
37
-
38
-
39
-
40
-
41
-
42
-
43
-
44
-
45
-
46
-
47
-
48
-
49
-
50
-
51
-
52
-
53
-
54
-
 55
55 -
 56
56 -
 57
57 -
 58
58 -
 59
59 -
 60
60 -
 61
61 -
 62
62 -
 63
63 -
 64
64 -
 65
65 -
 66
66 -
 67
67 -
 68
68 -
 69
69 -
 70
70 -
 71
71 -
 72
72 -
 73
73 -
 74
74 -
 75
75 -
76
-
77
-
78
-
79
-
80
-
81
-
82
-
83
-
84
-
85
-
86
-
87
-
88
-
89
-
90
-
91
-
92
-
93
-
94
-
95
-
96
-
97
-
98
-
99
-
100
-
101
-
102
-
103
-
104
-
105
-
106
-
107
-
108
-
109
-
110
-
111
-
112
-
113
-
114
-
115
-
116
-
117
-
118
-
119
-
120
-
121
-
122
-
123
-
124
-
125
-
126
-
127
-
128
-
129
-
130
-
131
-
132
-
133
-
134
-
135
-
136
-
137
-
138
-
139
-
140
-
141
-
142
-
143
-
144
-
145
-
146
-
147
-
148
-
149
-
150
-
151
-
152
-
153
-
154
-
155
-
156
-
157
-
158
-
159
-
160
-
161
-
162
-
163
-
164
-
165
-
166
-
167
-
168
-
169
-
170
-
171
-
172
-
173
-
174
-
175
-
176
-
177
-
178
-
179
-
180
-
181
-
182
-
183
-
184
-
185
-
186
-
187
-
188
-
189
-
190
-
191
-
192
-
193
-
194
-
195
-
196
-
197
-
198
-
199
-
200
-
201
-
202
-
203
-
204
-
205
-
206
-
207
-
208
-
209
-
210
-
211
-
212
-
213
-
214
-
215
-
216
-
217
-
218
-
219
-
220
-
221
-
222
-
223
-
224
-
225
-
226
 |
 |
45
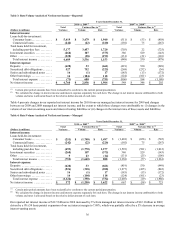
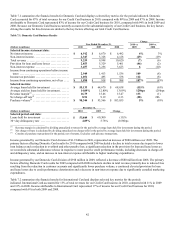
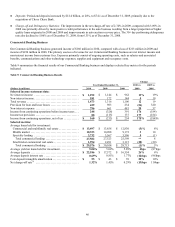
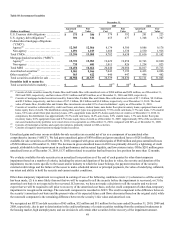
Key factors affecting the results of our Consumer Banking business for 2010, compared with 2009 included the following:
● Net Interest Income: Our Consumer Banking business experienced an increase in net interest income of $496 million, or 15%, in
2010. The primary drivers of the increase in net interest income were improved loan margins, primarily resulting from higher
pricing for new auto loan originations, deposit growth resulting from our continued strategy to leverage our banking branches to
attract lower cost funding sources and improved deposit spreads. The favorable impact from these factors more than offset the
decline in average loans held for investment resulting from the continued run-off of home loans and reduction in auto loans in
2010.
● Non-Interest Income: Non-interest income increased by $115 million, or 15%, in 2010. The increase was primarily attributable to
a gain of $128 million recorded in the first quarter of 2010 related to the deconsolidation of certain option-adjustable rate
mortgage trusts that were consolidated on January 1, 2010 as a result of our adoption of the new consolidation accounting
standards.
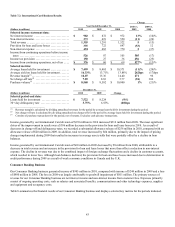
● Provision for Loan and Lease Losses: The provision for loan and lease losses decreased by $635 million in 2010, to $241 million.
The substantial reduction in the provision was attributable to continued improvement in credit performance trends and reduced
loan balances. Delinquency and charge-off rates declined throughout the year, reflecting the impact of the gradual improvement in
economic conditions and the higher credit quality of our most recent auto loan vintages. As a result, the Consumer Banking
business recorded a net allowance release (after taking into consideration the impact of the $73 million addition to the allowance
on January 1, 2010 from the adoption of the new consolidation accounting standards) of $474 million in 2010. In comparison, the
Consumer Banking business recorded an allowance release of $238 million in 2009, primarily due to declining loan balances.
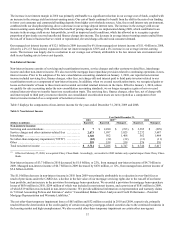
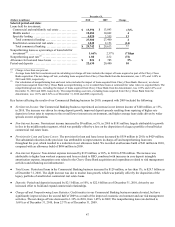
● Non-Interest Expense: Non-interest expense increased by $216 million, or 8%, in 2010. This increase was largely attributable to
infrastructure expenditures, primarily in our home loan and retail banking operations, made in 2010 to attract and support new
business volume and to integrate Chevy Chase Bank, and increased marketing expenditures related to our retail banking
operations.
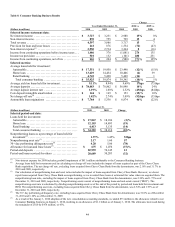
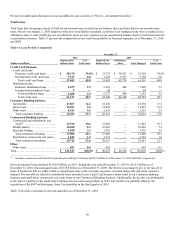
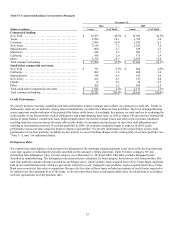
● Total Loans: Period-end loans in the Consumer Banking business declined by $3.8 billion, or 10%, in 2010 to $34.4 billion as of
December 31, 2010, from $38.2 billion as of December 31, 2009, primarily due to the run-off of home loans and a reduction in
auto loan balances.
● Deposits: Period-end deposits in the Consumer Banking business increased by $8.8 billion, or 12%, during 2010 to $83.0 billion
as of December 31, 2010, reflecting the impact of our strategy to replace maturing higher cost wholesale funding sources with
lower cost funding sources and our increased retail marketing efforts to attract new business to meet this objective.
● Charge-off and Delinquency Statistics: The net charge-off and delinquency rates for the Consumer Banking business, improved
during 2010 as a result of the improved economic environment and a tightening of our underwriting standards on new loan
originations. The net charge-off rate decreased to 1.82% as of December 31, 2010, down significantly from the net charge-off rate
of 2.74% as of December 31, 2009. The 30+ day performing delinquency rate, which was 4.28% as of December 31, 2010, has
declined from a rate of 5.06% as of December 31, 2009.
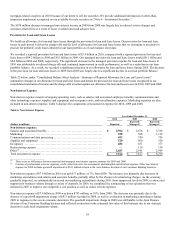
Key factors affecting the results of our Consumer Banking business for 2009, compared with 2008 included the following:
● Net Interest Income: Our Consumer Banking business experienced an increase in net interest income of $243 million, or 8%, in
2009, primarily attributable to the acquisition of the Chevy Chase Bank portfolio in the first quarter of 2009.
● Non-Interest Income: Non-interest income increased by $26 million, or 4%, in 2009, primarily driven by the acquisition of the
Chevy Chase Bank portfolio in the first quarter of 2009.
● Provision for Loan and Lease Losses: The provision for loan and lease losses declined by $658 million, or 43%, in 2009. The
decrease was primarily driven by reduced losses and shrinkage in our auto loan business, partially offset by allowance builds in
the retail banking and home loan businesses.
● Non-Interest Expense: Non-interest expense decreased by $530 million, or 16%, in 2009. Excluding the impact of goodwill
impairment of $811 million recognized in 2009, non-interest expense increased by $281 million over 2008. This increase was
driven by incremental operating costs from the Chevy Chase acquisition and increased loan workout and mitigation costs in the
home loan business, which was partially offset by a significant decrease in marketing expenditures.
● Total Loans: Period-end loans in the Consumer Banking business increased by $1.0 billion, or 3%, to $38.2 billion as of
December 31, 2009, primarily due to the acquisition of the Chevy Chase mortgage portfolio.