Capital One 2010 Annual Report Download - page 182
Download and view the complete annual report
Please find page 182 of the 2010 Capital One annual report below. You can navigate through the pages in the report by either clicking on the pages listed below, or by using the keyword search tool below to find specific information within the annual report.-
 1
1 -
2
-
3
-
4
-
5
-
6
-
7
-
8
-
9
-
10
-
11
-
12
-
13
-
14
-
15
-
16
-
17
-
18
-
19
-
20
-
21
-
22
-
23
-
24
-
25
-
26
-
27
-
28
-
29
-
30
-
31
-
32
-
33
-
34
-
35
-
36
-
37
-
38
-
39
-
40
-
41
-
42
-
43
-
44
-
45
-
46
-
47
-
48
-
49
-
50
-
51
-
52
-
53
-
54
-
55
-
56
-
57
-
58
-
59
-
60
-
61
-
62
-
63
-
64
-
65
-
66
-
67
-
68
-
69
-
70
-
71
-
72
-
73
-
74
-
75
-
76
-
77
-
78
-
79
-
80
-
81
-
82
-
83
-
84
-
85
-
86
-
87
-
88
-
89
-
90
-
91
-
92
-
93
-
94
-
95
-
96
-
97
-
98
-
99
-
100
-
101
-
102
-
103
-
104
-
105
-
106
-
107
-
108
-
109
-
110
-
111
-
112
-
113
-
114
-
115
-
116
-
117
-
118
-
119
-
120
-
121
-
122
-
123
-
124
-
125
-
126
-
127
-
128
-
129
-
130
-
131
-
132
-
133
-
134
-
135
-
136
-
137
-
138
-
139
-
140
-
141
-
142
-
143
-
144
-
145
-
146
-
147
-
148
-
149
-
150
-
151
-
152
-
153
-
154
-
155
-
156
-
157
-
158
-
159
-
160
-
161
-
162
-
163
-
164
-
165
-
166
-
167
-
168
-
169
-
170
-
171
-
 172
172 -
 173
173 -
 174
174 -
 175
175 -
 176
176 -
 177
177 -
 178
178 -
 179
179 -
 180
180 -
 181
181 -
 182
182 -
 183
183 -
 184
184 -
 185
185 -
 186
186 -
 187
187 -
 188
188 -
 189
189 -
 190
190 -
 191
191 -
 192
192 -
193
-
194
-
195
-
196
-
197
-
198
-
199
-
200
-
201
-
202
-
203
-
204
-
205
-
206
-
207
-
208
-
209
-
210
-
211
-
212
-
213
-
214
-
215
-
216
-
217
-
218
-
219
-
220
-
221
-
222
-
223
-
224
-
225
-
226
 |
 |

CAPITAL ONE FINANCIAL CORPORATION
NOTES TO CONSOLIDATED STATEMENTS
162
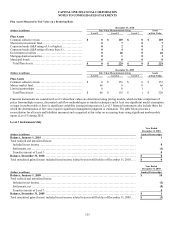
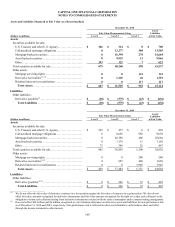
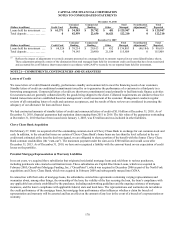
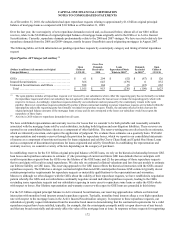
Year Ended December 31, 2009
(Dollars in millions)
Securities
Available
for Sale
Mortgage
Servicing
Rights Derivative
Receivables(2)
Retained
Interests in
Securitizations(3) Derivative
Payables(2)
Balance, January 1, 2009 ..................... $ 2,380 $ 151 $ 60 $ 1,470 $ 61
Total realized and unrealized gains (losses):
Included in net income ..................... 0 (6)(1) (214) (131) (28)
Included in other comprehensive income ..... (168) 0 0 114 0
Purchases, sales, issuances and settlements,
net ...................................... (115) 95 38 2,492 4
Transfers in/(out) of Level 3 ................ (591) 0 556 0 (4)
Balance, December 31, 2009 .................. $ 1,506 $ 240 $ 440 $ 3,945 $ 33
Total unrealized gains (losses) included in net
income related to assets and liabilities still
held as of December 31, 2009(5) ............. $ 0 $ (6) $ (214) $ 71 $ (28)
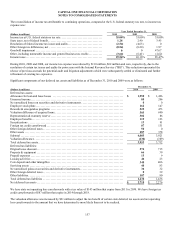
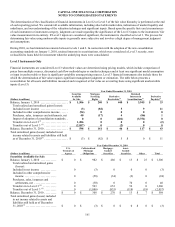
Year Ended December 31, 2009
(Dollars in millions)
U.S.
Treasury &
Agency
Collateralized
Mortgage
Obligations
Mortgage-
backed
Securities
Asset-
backed
Securities Other Total
Securities Available for Sale
Balance, January 1, 2009 ........
.
$ 0 $ 1,580 $ 773 $ 0 $ 27 $ 2,380
Total realized and unrealized
gains (losses):
Included in net income ........
.
0 0 0 0 0 0
Included in other comprehensive
income .....................
.
0 (175) 7 0 0 (168)
Purchases, sales, issuances and
settlements, net .............
.
0 (235) 48 74 (2) (115)
Transfers in/out of Level 3 (4) . ..
.
0 (188) (342) (61) 0 (591)
Balance, December 31, 2009 .....
.
$ 0 $ 982 $ 486 $ 13 $ 25 $ 1,506
Total unrealized gains (losses)
included in net income related to
assets and liabilities still held as
of December 31, 2009(5) .......
.
$ 0 $ 0 $ 0 $ 0 $ 0 $ 0
________________________
(1) Gains (losses) related to Level 3 mortgage servicing rights are reported in mortgage servicing and other income, which is a component of non-
interest income.
(2) An end of quarter convention is used to measure derivative activity, resulting in end of quarter values being reflected as purchases, issuances
and settlements for derivatives having a zero fair value at inception. Gains (losses) related to Level 3 derivative receivables and derivative
payables are reported in other non-interest income, which is a component of non-interest income.
(3) An end of quarter convention is used to reflect activity in retained interests in securitizations, resulting in all transactions and assumption
changes being reflected as if they occurred on the last day of the quarter. Gains (losses) related to Level 3 retained interests in securitizations are
reported in servicing and securitizations income, which is a component of non-interest income.
(4) The transfer out of Level 3 for the year ended December 31, 2010 was primarily driven by greater consistency amongst multiple pricing sources.
The transfer into Level 3 were primarily driven by less consistency amongst vendor pricing on individual securities for non-agency MBS.
(5) The amount presented for unrealized gains (loss) for assets still held as of the reporting date primarily represents impairments for available-for-
sale securities and accretion on certain fixed maturity securities, and are reported in total other-than-temporary losses as a component of non-
interest income.
Assets and Liabilities Measured at Fair Value on a Nonrecurring Basis
We are required to measure and recognize certain other financial assets at fair value on a nonrecurring basis in the consolidated
balance sheet. These financial assets are not measured at fair value on an ongoing basis but are subject to fair value adjustments in
certain circumstances (for example, when we evaluate impairment). Fair value adjustments for loans held for sale, foreclosed assets,
and other assets are recorded in other non-interest expense, and fair value adjustments for loans held for investment are recorded in
provision for loan and lease losses in the consolidated statement of income.