Capital One 2010 Annual Report Download - page 56
Download and view the complete annual report
Please find page 56 of the 2010 Capital One annual report below. You can navigate through the pages in the report by either clicking on the pages listed below, or by using the keyword search tool below to find specific information within the annual report.-
 1
1 -
2
-
3
-
4
-
5
-
6
-
7
-
8
-
9
-
10
-
11
-
12
-
13
-
14
-
15
-
16
-
17
-
18
-
19
-
20
-
21
-
22
-
23
-
24
-
25
-
26
-
27
-
28
-
29
-
30
-
31
-
32
-
33
-
34
-
35
-
36
-
37
-
38
-
39
-
40
-
41
-
42
-
43
-
44
-
45
-
 46
46 -
 47
47 -
 48
48 -
 49
49 -
 50
50 -
 51
51 -
 52
52 -
 53
53 -
 54
54 -
 55
55 -
 56
56 -
 57
57 -
 58
58 -
 59
59 -
 60
60 -
 61
61 -
 62
62 -
 63
63 -
 64
64 -
 65
65 -
 66
66 -
67
-
68
-
69
-
70
-
71
-
72
-
73
-
74
-
75
-
76
-
77
-
78
-
79
-
80
-
81
-
82
-
83
-
84
-
85
-
86
-
87
-
88
-
89
-
90
-
91
-
92
-
93
-
94
-
95
-
96
-
97
-
98
-
99
-
100
-
101
-
102
-
103
-
104
-
105
-
106
-
107
-
108
-
109
-
110
-
111
-
112
-
113
-
114
-
115
-
116
-
117
-
118
-
119
-
120
-
121
-
122
-
123
-
124
-
125
-
126
-
127
-
128
-
129
-
130
-
131
-
132
-
133
-
134
-
135
-
136
-
137
-
138
-
139
-
140
-
141
-
142
-
143
-
144
-
145
-
146
-
147
-
148
-
149
-
150
-
151
-
152
-
153
-
154
-
155
-
156
-
157
-
158
-
159
-
160
-
161
-
162
-
163
-
164
-
165
-
166
-
167
-
168
-
169
-
170
-
171
-
172
-
173
-
174
-
175
-
176
-
177
-
178
-
179
-
180
-
181
-
182
-
183
-
184
-
185
-
186
-
187
-
188
-
189
-
190
-
191
-
192
-
193
-
194
-
195
-
196
-
197
-
198
-
199
-
200
-
201
-
202
-
203
-
204
-
205
-
206
-
207
-
208
-
209
-
210
-
211
-
212
-
213
-
214
-
215
-
216
-
217
-
218
-
219
-
220
-
221
-
222
-
223
-
224
-
225
-
226
 |
 |

36
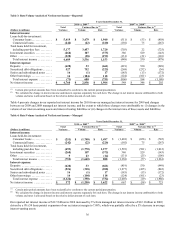
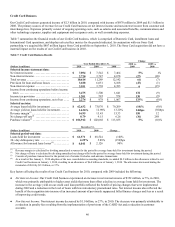
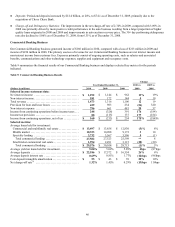
Table 3: Rate/Volume Analysis of Net Interest Income—Reported
Years Ended December 31,
2010 vs. 2009(1) 2009(1) vs. 2008(1)
Total Variance Due to (2) Total Variance Due to (2)
(Dollars in millions) Variance Volume Rate Variance Volume Rate
Interest income:
Loans held-for-investment:
Consumer loans ................ $ 5,419 $ 3,479 $ 1,940 $ (511) $ (53) $ (458)
Commercial loans .............. (242) (22) (220) (192) 75 (267)
Total loans held for investment,
including past-due fees ......... 5,177 3,457 1,720 (703) 22 (725)
Investment securities ............. (268) 107 (375) 386 529 (143)
Other ........................... (220) (28) (192) (131) (21) (110)
Total interest income ........... 4,689 3,536 1,153 (448) 530 (978)
Interest expense:
Deposits ........................ (628) 33 (661) (419) 530 (949)
Securitized debt obligations ....... 527 752 (225) (268) (232) (36)
Senior and subordinated notes ..... 16 (1) 17 (185) (13) (172)
Other borrowings ................ 14 (104) 118 (124) (101) (23)
Total interest expense .......... (71) 680 (751) (996) 184 (1,180)
N
et interest income .............. $ 4,760 $ 2,856 $ 1,904 $ 548 $ 346 $ 202
________________________
(1) Certain prior period amounts have been reclassified to conform to the current period presentation.
(2) We calculate the change in interest income and interest expense separately for each item. The change in net interest income attributable to both
volume and rates is allocated based on the relative dollar amount of each item.
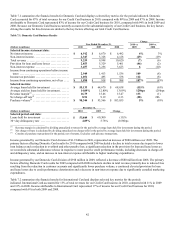
Table 4 presents changes in our reported net interest income for 2010 from our managed net interest income for 2009 and changes
between our 2009 and 2008 managed net interest income, and the extent to which those changes were attributable to: (i) changes in the
volume of our interest-earning assets and interest-bearing liabilities or (ii) changes in the interest rates of these assets and liabilities.
Table 4: Rate/Volume Analysis of Net Interest Income—Managed
Years Ended December 31,
2010 vs. 2009(1) 2009(1) vs. 2008(1)
Total Variance Due to (2) Total Variance Due to (2)
(Dollars in millions) Variance Volume Rate Variance Volume Rate
Interest income:
Loans held-for-investment:
Consumer loans ................ $ (251) $ (1,748) $ 1,497 $ (1,401) $ (656) $ (745)
Commercial loans .............. (242) (22) (220) (192) 75 (267)
Total loans held for investment,
including past-due fees ......... (493) (1,770) 1,277 (1,593) (581) (1,012)
Investment securities ............. (268) 107 (375) 386 529 (143)
Other ........................... 9 23 (14) (131) (25) (106)
Total interest income ........... (752) (1,640) 888 (1,338) (77) (1,261)
Interest expense:
Deposits ........................ (628) 33 (661) (419) 530 (949)
Securitized debt obligations ....... (526) (318) (208) (1,277) (435) (842)
Senior and subordinated notes ..... 16 (1) 17 (185) (13) (172)
Other borrowings ................ 14 (104) 118 (124) (101) (23)
Total interest expense .......... (1,124) (390) (734) (2,005) (19) (1,986)
N
et interest income .............. $ 372 $ (1,250) $ 1,622 $ 667 $ (58) $ 725
________________________
(1) Certain prior period amounts have been reclassified to conform to the current period presentation.
(2) We calculate the change in interest income and interest expense separately for each item. The change in net interest income attributable to both
volume and rates is allocated based on the relative dollar amount of each item.
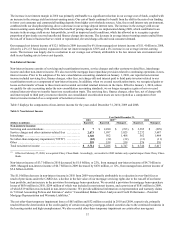
Our reported net interest income of $12.5 billion in 2010 increased by 3% from managed net interest income of $12.1 billion in 2009,
driven by a 9% (59 basis points) expansion of our net interest margin to 7.09%, which was partially offset by a 5% decrease in average
interest-earning assets.