Capital One 2010 Annual Report Download - page 96
Download and view the complete annual report
Please find page 96 of the 2010 Capital One annual report below. You can navigate through the pages in the report by either clicking on the pages listed below, or by using the keyword search tool below to find specific information within the annual report.-
 1
1 -
2
-
3
-
4
-
5
-
6
-
7
-
8
-
9
-
10
-
11
-
12
-
13
-
14
-
15
-
16
-
17
-
18
-
19
-
20
-
21
-
22
-
23
-
24
-
25
-
26
-
27
-
28
-
29
-
30
-
31
-
32
-
33
-
34
-
35
-
36
-
37
-
38
-
39
-
40
-
41
-
42
-
43
-
44
-
45
-
46
-
47
-
48
-
49
-
50
-
51
-
52
-
53
-
54
-
55
-
56
-
57
-
58
-
59
-
60
-
61
-
62
-
63
-
64
-
65
-
66
-
67
-
68
-
69
-
70
-
71
-
72
-
73
-
74
-
75
-
76
-
77
-
78
-
79
-
80
-
81
-
82
-
83
-
84
-
85
-
 86
86 -
 87
87 -
 88
88 -
 89
89 -
 90
90 -
 91
91 -
 92
92 -
 93
93 -
 94
94 -
 95
95 -
 96
96 -
 97
97 -
 98
98 -
 99
99 -
 100
100 -
 101
101 -
 102
102 -
 103
103 -
 104
104 -
 105
105 -
 106
106 -
107
-
108
-
109
-
110
-
111
-
112
-
113
-
114
-
115
-
116
-
117
-
118
-
119
-
120
-
121
-
122
-
123
-
124
-
125
-
126
-
127
-
128
-
129
-
130
-
131
-
132
-
133
-
134
-
135
-
136
-
137
-
138
-
139
-
140
-
141
-
142
-
143
-
144
-
145
-
146
-
147
-
148
-
149
-
150
-
151
-
152
-
153
-
154
-
155
-
156
-
157
-
158
-
159
-
160
-
161
-
162
-
163
-
164
-
165
-
166
-
167
-
168
-
169
-
170
-
171
-
172
-
173
-
174
-
175
-
176
-
177
-
178
-
179
-
180
-
181
-
182
-
183
-
184
-
185
-
186
-
187
-
188
-
189
-
190
-
191
-
192
-
193
-
194
-
195
-
196
-
197
-
198
-
199
-
200
-
201
-
202
-
203
-
204
-
205
-
206
-
207
-
208
-
209
-
210
-
211
-
212
-
213
-
214
-
215
-
216
-
217
-
218
-
219
-
220
-
221
-
222
-
223
-
224
-
225
-
226
 |
 |

76
Under prompt corrective action capital regulations, a bank is considered to be well capitalized if it maintains a total risk-based capital
ratio of at least 10% (200 basis points higher than the above minimum capital standard), a Tier 1 risk-based capital ratio of at least 6%,
a Tier 1 leverage capital ratio of at least 5% and not be subject to any supervisory agreement, order, or directive to meet and maintain
a specific capital level for any capital reserve. A bank is considered to be adequately capitalized if it meets the above minimum capital
ratios and does not otherwise meet the well capitalized definition. Currently, prompt corrective action capital requirements do not
apply to bank holding companies.
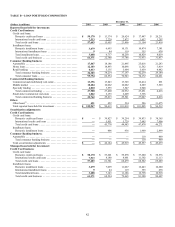
In addition to disclosing our regulatory capital ratios, we also disclose Tier 1 common equity and TCE ratios, which are non-GAAP
measures widely used by investors, analysts, rating agencies and bank regulatory agencies to assess the capital position of financial
services companies. There is currently no mandated minimum or “well capitalized” standard for Tier 1 common equity; instead the
risk-based capital rules state voting common stockholders’ equity should be the dominant element within Tier 1 common equity.
Management reviews our Tier 1 common equity and TCE ratios, along with other measures of capital, as part of its financial analyses
and discloses these non-GAAP capital measures because of current interest in such information on the part of market participants.
Please see “Financial Highlights” under “Executive Summary and Business Outlook” for more information on our TCE ratio. Table
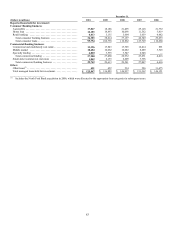
35 provides the details of the calculation of our capital ratios, including a reconciliation of the total stockholders’ equity reported in
our consolidated balance sheets to Tier 1 common equity.
Table 35: Risk-Based Capital Components
December 31,
(Dollars in millions) 2010 2009
Total stockholders’ equity ...................................................................
.
$ 26,541 $ 26,590
Less: Net unrealized (gains) on available-for sale-securities recorded in AOCI(1) ..................
.
(368) (200)
Net losses on cash flow hedges recorded in AOCI(1) .......................................
.
86 92
Disallowed goodwill and other intangible assets ..........................................
.
(13,953) (14,125)
Disallowed deferred tax assets ..........................................................
.
(1,150)
—
Other .................................................................................
.
(2) (10)
Tier 1 common equity ......................................................................
.
11,154 12,347
Plus: Tier 1 restricted core capital items(2) .....................................................
.
3,636 3,642
Tier 1 risk-based capital ...................................................................
.
14,790 15,989
Plus: Long-term debt qualifying as Tier 2 capital ..............................................
.
2,827 3,018
Qualifying allowance for loan and lease losses ...........................................
.
3,748 1,581
Other Tier 2 components ...............................................................
.
29 4
Tier 2 risk-based capital ...................................................................
.
6,604 4,603
Total risk-based capital ....................................................................
.
$ 21,394 $ 20,592
Risk-weighted assets(3) ......................................................................
.
$ 127,043 $ 116,309
________________________
(1) Amounts presented are net of tax.
(2) Consists primarily of trust preferred securities.
(3) Under regulatory guidelines for risk-based capital, on-balance sheet assets and credit equivalent amounts of derivatives and off-balance sheet
items are assigned to one of several broad risk categories according to the obligor or, if relevant, the guarantor or the nature of any collateral.
The aggregate dollar amount in each risk category is then multiplied by the risk weight associated with that category. The resulting weighted
values from each of the risk categories are aggregated for determining total risk-weighted assets.
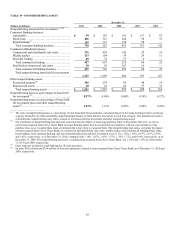
Table 36 provides a comparison of our capital ratios under the Federal Reserve’s capital adequacy standards; and the capital ratios of
the Banks under the OCC’s capital adequacy standards as of December 31, 2010 and 2009. As of December 31, 2010, we exceeded
minimum capital requirements and would meet the “well-capitalized” ratio levels specified under prompt corrective action for total
risk-based capital and Tier 1 risk-based capital under Federal Reserve capital standards for bank holding companies. As of December
31, 2010, the Banks also exceeded minimum regulatory requirements under the OCC’s applicable capital adequacy guidelines and
were “well-capitalized” under prompt corrective action requirements.