Capital One 2010 Annual Report Download - page 216
Download and view the complete annual report
Please find page 216 of the 2010 Capital One annual report below. You can navigate through the pages in the report by either clicking on the pages listed below, or by using the keyword search tool below to find specific information within the annual report.-
 1
1 -
2
-
3
-
4
-
5
-
6
-
7
-
8
-
9
-
10
-
11
-
12
-
13
-
14
-
15
-
16
-
17
-
18
-
19
-
20
-
21
-
22
-
23
-
24
-
25
-
26
-
27
-
28
-
29
-
30
-
31
-
32
-
33
-
34
-
35
-
36
-
37
-
38
-
39
-
40
-
41
-
42
-
43
-
44
-
45
-
46
-
47
-
48
-
49
-
50
-
51
-
52
-
53
-
54
-
55
-
56
-
57
-
58
-
59
-
60
-
61
-
62
-
63
-
64
-
65
-
66
-
67
-
68
-
69
-
70
-
71
-
72
-
73
-
74
-
75
-
76
-
77
-
78
-
79
-
80
-
81
-
82
-
83
-
84
-
85
-
86
-
87
-
88
-
89
-
90
-
91
-
92
-
93
-
94
-
95
-
96
-
97
-
98
-
99
-
100
-
101
-
102
-
103
-
104
-
105
-
106
-
107
-
108
-
109
-
110
-
111
-
112
-
113
-
114
-
115
-
116
-
117
-
118
-
119
-
120
-
121
-
122
-
123
-
124
-
125
-
126
-
127
-
128
-
129
-
130
-
131
-
132
-
133
-
134
-
135
-
136
-
137
-
138
-
139
-
140
-
141
-
142
-
143
-
144
-
145
-
146
-
147
-
148
-
149
-
150
-
151
-
152
-
153
-
154
-
155
-
156
-
157
-
158
-
159
-
160
-
161
-
162
-
163
-
164
-
165
-
166
-
167
-
168
-
169
-
170
-
171
-
172
-
173
-
174
-
175
-
176
-
177
-
178
-
179
-
180
-
181
-
182
-
183
-
184
-
185
-
186
-
187
-
188
-
189
-
190
-
191
-
192
-
193
-
194
-
195
-
196
-
197
-
198
-
199
-
200
-
201
-
202
-
203
-
204
-
205
-
 206
206 -
 207
207 -
 208
208 -
 209
209 -
 210
210 -
 211
211 -
 212
212 -
 213
213 -
 214
214 -
 215
215 -
 216
216 -
 217
217 -
 218
218 -
 219
219 -
 220
220 -
 221
221 -
 222
222 -
 223
223 -
 224
224 -
 225
225 -
 226
226
 |
 |

Page 1
CAPITAL ONE FINANCIAL CORPORATION (COF)
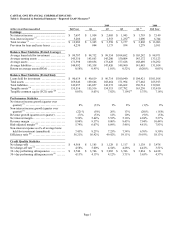
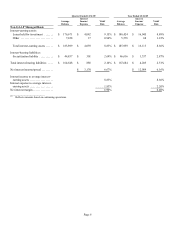
Table 1: Financial & Statistical Summary—Reported GAAP Measures(1)
2009 2008
(dollars in millions)(unaudited) Full Year Q4 Q3 Q2 Q1 (2) Full Year
Earnings
N
et interest income ......................... $ 7,697 $ 1,954 $ 2,005 $ 1,945 $ 1,793 $ 7,149
N
on-interest income (3) ....................... 5,286 1,411 1,553 1,232(4) 1,090 6,744
Total revenue (5) ............................. $ 12,983 $ 3,365 $ 3,558 $ 3,177 $ 2,883 $ 13,893
Provision for loan and lease losses ............ 4,230 844 1,173 934 1,279 5,101
Balance Sheet Statistics (Period Average)
Average loans held for investment ............ $ 99,787 $ 94,732 $ 99,354 $ 104,682 $ 103,242 $ 98,971
Average earning assets ...................... 145,310 143,663 145,280 150,804 145,172 133,123
Average assets .............................. 171,598 169,856 173,428 177,628 168,489 156,292
Average liabilities ........................... 144,992 143,338 147,426 149,960 141,485 131,014
Return on average assets (ROA) .............. 0.58% 0.95% 1.01% 0.52% (0.20)% 0.05%
Balance Sheet Statistics (Period End)
Loans held for investment ................... $ 90,619 $ 90,619 $ 96,714 $ 100,940 $ 104,921 $ 101,018
Total assets ................................. 169,646 169,646 168,464 171,994 177,462 165,913
Total liabilities .............................. 143,057 143,057 142,272 146,662 150,714 139,301
Tangible assets (A) ........................... 155,516 155,516 154,315 157,782 163,230 153,410
Tangible common equity (TCE) ratio (B) ...... 8.03% 8.03% 7.82% 7.10%(6) 5.75% 7.18%
Performance Statistics
N
et interest income growth (quarter over
quarter) (7) ................................ 8% (3)% 3% 8% (1)% 9%
N
on-interest income growth (quarter over
quarter) (7) ................................ (22) % (9)% 26% 13% (20)% (16)%
Revenue growth (quarter over quarter) ........ (7)% (5)% 12% 10% (9)% (5)%
N
et interest margin .......................... 5.30% 5.44% 5.52% 5.16% 4.94% 5.37%
Revenue margin ............................ 8.94% 9.37% 9.80% 8.43% 7.94% 10.44%
Risk-adjusted margin (C) ..................... 5.79% 6.07% 6.69% 5.46% 4.81% 7.83%
N
on-interest expense as a% of average loans
held for investment (annualized) ........... 7.43% 8.23% 7.25% 7.34% 6.76% 8.30%
Efficiency ratio (D) .......................... 56.21% 56.92% 49.92% 59.11% 59.93% 58.13%
Credit Quality Statistics
N
et charge-offs ............................. $ 4,568 $ 1,185 $ 1,128 $ 1,117 $ 1,138 $ 3,478
N
et charge-off rate (8) ........................ 4.58% 5.00% 4.54% 4.28% 4.41% 3.51%
30+ day performing delinquencies ............ $ 3,746 $ 3,746 $ 3,983 $ 3,746 $ 3,834 $ 4,418
30+ day performing delinquency rate (8) ....... 4.13% 4.13% 4.12% 3.71% 3.65% 4.37%