Capital One 2010 Annual Report Download - page 197
Download and view the complete annual report
Please find page 197 of the 2010 Capital One annual report below. You can navigate through the pages in the report by either clicking on the pages listed below, or by using the keyword search tool below to find specific information within the annual report.-
 1
1 -
2
-
3
-
4
-
5
-
6
-
7
-
8
-
9
-
10
-
11
-
12
-
13
-
14
-
15
-
16
-
17
-
18
-
19
-
20
-
21
-
22
-
23
-
24
-
25
-
26
-
27
-
28
-
29
-
30
-
31
-
32
-
33
-
34
-
35
-
36
-
37
-
38
-
39
-
40
-
41
-
42
-
43
-
44
-
45
-
46
-
47
-
48
-
49
-
50
-
51
-
52
-
53
-
54
-
55
-
56
-
57
-
58
-
59
-
60
-
61
-
62
-
63
-
64
-
65
-
66
-
67
-
68
-
69
-
70
-
71
-
72
-
73
-
74
-
75
-
76
-
77
-
78
-
79
-
80
-
81
-
82
-
83
-
84
-
85
-
86
-
87
-
88
-
89
-
90
-
91
-
92
-
93
-
94
-
95
-
96
-
97
-
98
-
99
-
100
-
101
-
102
-
103
-
104
-
105
-
106
-
107
-
108
-
109
-
110
-
111
-
112
-
113
-
114
-
115
-
116
-
117
-
118
-
119
-
120
-
121
-
122
-
123
-
124
-
125
-
126
-
127
-
128
-
129
-
130
-
131
-
132
-
133
-
134
-
135
-
136
-
137
-
138
-
139
-
140
-
141
-
142
-
143
-
144
-
145
-
146
-
147
-
148
-
149
-
150
-
151
-
152
-
153
-
154
-
155
-
156
-
157
-
158
-
159
-
160
-
161
-
162
-
163
-
164
-
165
-
166
-
167
-
168
-
169
-
170
-
171
-
172
-
173
-
174
-
175
-
176
-
177
-
178
-
179
-
180
-
181
-
182
-
183
-
184
-
185
-
186
-
 187
187 -
 188
188 -
 189
189 -
 190
190 -
 191
191 -
 192
192 -
 193
193 -
 194
194 -
 195
195 -
 196
196 -
 197
197 -
 198
198 -
 199
199 -
 200
200 -
 201
201 -
 202
202 -
 203
203 -
 204
204 -
 205
205 -
 206
206 -
 207
207 -
208
-
209
-
210
-
211
-
212
-
213
-
214
-
215
-
216
-
217
-
218
-
219
-
220
-
221
-
222
-
223
-
224
-
225
-
226
 |
 |

CAPITAL ONE FINANCIAL CORPORATION
NOTES TO CONSOLIDATED STATEMENTS
177
involves unsettled areas of law, we accounted for this matter applying the recognition and measurement criteria required for
accounting for uncertainty in income taxes.
For some of the matters disclosed above, we are able to determine estimates of potential future outcomes that that are not probable and
reasonably estimable outcomes justifying either the establishment of a reserve or an incremental reserve build, but which are
reasonably possible outcomes. For other disclosed matters, such an estimate is not possible at this time. For those matters where an
estimate is possible, excluding the reasonably possible future losses relating to the US Bank Litigation and the DBSP Litigation
because reasonably possible losses with respect to those litigations are included within the range of reasonably possible representation
and warranty liabilities discussed above, management currently estimates the aggregate high end of the range of possible loss is $73
million to $171 million. Notwithstanding our attempt to estimate a reasonably possible range of loss beyond our current accrual levels
for some litigation matters based on current information, it is possible that actual future losses will exceed both the current accrual
level and the range of reasonably possible losses disclosed here. Given the inherent uncertainties involved in these matters, and the
very large or indeterminate damages sought in some of these matters, there is significant uncertainty as to the ultimate liability we may
incur from these litigation matters and an adverse outcome in one or more of these matters could be material to the our results of
operations or cash flows for any particular reporting period.
Other Pending and Threatened Litigation
In addition, we are commonly subject to various pending and threatened legal actions relating to the conduct of our normal business
activities. In the opinion of management, the ultimate aggregate liability, if any, arising out of all such other pending or threatened
legal actions will not be material to our consolidated financial position or our results of operations.
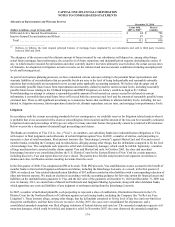
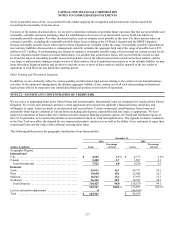
NOTE 22—SIGNIFICANT CONCENTRATION OF CREDIT RISK
We are active in originating loans in the United States and internationally. International loans are originated in Canada and the United
Kingdom. We review each potential customer’s credit application and evaluate the applicant’s financial history and ability and
willingness to repay. Loans are made on an unsecured and secured basis. Certain commercial, small business, home loans and
automobile loans require collateral in various forms including cash deposits, automobiles and real estate, as appropriate. We have
higher concentrations of loans where the Commercial and Consumer Banking segments operate, the South and Northeast regions of
the U.S. In particular, our commercial portfolio is concentrated in the New York metropolitan area. The regional economic conditions
in the New York area affect the demand for our commercial products and services as well as the ability of our customers to repay their
commercial loans and the value of the collateral securing these loans.
The following table presents the geographic distribution of our loan portfolio:
December 31,
2010 2009
Percentage
of Total
Percentage
of Total
(Dollars in millions) Loans Loans
Geographic Region:
International
U.K. ................................................. $ 4,102 3.3% $ 4,717 3.4%
Canada .............................................. 3,420 2.7 3,507 2.6
Total International .................................. 7,522 6.0 8,224 6.0
Domestic
South ................................................ 45,811 36.3 49,171 36.0
West ................................................ 19,690 15.6 22,842 16.7
Midwest ............................................. 16,562 13.2 17,973 13.1
N
ortheas
t
............................................ 36,362 28.9 38,593 28.2
Total Domestic ..................................... 118,425 94.0 128,579 94.0
125,947 100.0% 136,803 100.0%
Less securitization adjustments ........................ 0 (46,184)
Total ................................................ $ 125,947 $ 90,619