Capital One 2010 Annual Report Download - page 67
Download and view the complete annual report
Please find page 67 of the 2010 Capital One annual report below. You can navigate through the pages in the report by either clicking on the pages listed below, or by using the keyword search tool below to find specific information within the annual report.-
 1
1 -
2
-
3
-
4
-
5
-
6
-
7
-
8
-
9
-
10
-
11
-
12
-
13
-
14
-
15
-
16
-
17
-
18
-
19
-
20
-
21
-
22
-
23
-
24
-
25
-
26
-
27
-
28
-
29
-
30
-
31
-
32
-
33
-
34
-
35
-
36
-
37
-
38
-
39
-
40
-
41
-
42
-
43
-
44
-
45
-
46
-
47
-
48
-
49
-
50
-
51
-
52
-
53
-
54
-
55
-
56
-
 57
57 -
 58
58 -
 59
59 -
 60
60 -
 61
61 -
 62
62 -
 63
63 -
 64
64 -
 65
65 -
 66
66 -
 67
67 -
 68
68 -
 69
69 -
 70
70 -
 71
71 -
 72
72 -
 73
73 -
 74
74 -
 75
75 -
 76
76 -
 77
77 -
78
-
79
-
80
-
81
-
82
-
83
-
84
-
85
-
86
-
87
-
88
-
89
-
90
-
91
-
92
-
93
-
94
-
95
-
96
-
97
-
98
-
99
-
100
-
101
-
102
-
103
-
104
-
105
-
106
-
107
-
108
-
109
-
110
-
111
-
112
-
113
-
114
-
115
-
116
-
117
-
118
-
119
-
120
-
121
-
122
-
123
-
124
-
125
-
126
-
127
-
128
-
129
-
130
-
131
-
132
-
133
-
134
-
135
-
136
-
137
-
138
-
139
-
140
-
141
-
142
-
143
-
144
-
145
-
146
-
147
-
148
-
149
-
150
-
151
-
152
-
153
-
154
-
155
-
156
-
157
-
158
-
159
-
160
-
161
-
162
-
163
-
164
-
165
-
166
-
167
-
168
-
169
-
170
-
171
-
172
-
173
-
174
-
175
-
176
-
177
-
178
-
179
-
180
-
181
-
182
-
183
-
184
-
185
-
186
-
187
-
188
-
189
-
190
-
191
-
192
-
193
-
194
-
195
-
196
-
197
-
198
-
199
-
200
-
201
-
202
-
203
-
204
-
205
-
206
-
207
-
208
-
209
-
210
-
211
-
212
-
213
-
214
-
215
-
216
-
217
-
218
-
219
-
220
-
221
-
222
-
223
-
224
-
225
-
226
 |
 |

47
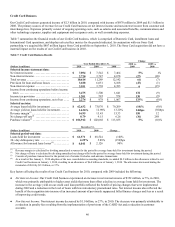
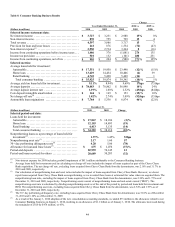
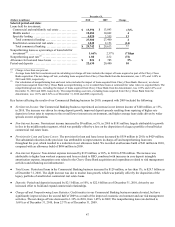
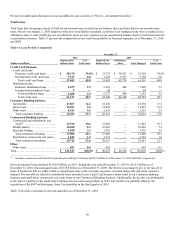
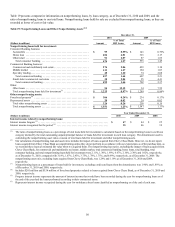
December 31,
(Dollars in millions) 2010 2009 Change
Selected period-end data:
Loans held for investment:
Commercial and multifamily real estate ..............
.
$ 13,396 $ 13,843 (3)%
Middle market .....................................
.
10,484 10,062 4
Specialty lending ..................................
.
4,020 3,555 13
Total commercial lending .........................
.
27,900 27,460 2
Small-ticket commercial real estate ..................
.
1,842 2,153 (14)
Total commercial banking ........................
.
$ 29,742 $ 29,613 **
N
onperforming loans as a percentage of loans held for
investment(2) .......................................
.
1.66% 2.37% (71)bps
N
onperforming asset rate(2) ...........................
.
1.80 2.52 (72)
Allowance for loan and lease losses ...................
.
$ 826 $ 785 5%
Period-end deposits ..................................
.
22,630 20,480 10
________________________
** Change is less than one percent.
(1) Average loans held for investment used in calculating net charge-off rates includes the impact of loans acquired as part of the Chevy Chase
Bank acquisition. The net charge-off rate, excluding loans acquired from Chevy Chase Bank from the denominator, was 1.35% and 1.48% in
2010 and 2009, respectively.
(2) Our calculation of nonperforming loan and asset ratios includes the impact of loans acquired from Chevy Chase Bank. However, we do not
report loans acquired from Chevy Chase Bank as nonperforming, as we recorded these loans at estimated fair value when we acquired them. The
nonperforming loan ratio, excluding the impact of loans acquired from Chevy Chase Bank from the denominator, was 1.69% and 2.43% as of
December 31, 2010 and 2009, respectively. The nonperforming asset rate, excluding loans acquired from Chevy Chase Bank from the
denominator, was 1.83% and 2.62% as of December 31, 2010 and 2009, respectively.
Key factors affecting the results of our Commercial Banking business for 2010, compared with 2009 included the following:
● Net Interest Income: Our Commercial Banking business experienced an increase in net interest income of $148 million, or 13%,
in 2010. The increase was driven by strong deposit growth, improved deposit spreads resulting from repricing of higher rate
deposits to lower rates in response to the overall lower interest rate environment, and higher average loan yields driven by wider
spreads on new originations.
● Non-Interest Income: Non-interest income increased by $9 million, or 5%, in 2010 to $181 million, largely attributable to growth
in fees in the middle market segment, which was partially offset by a loss on the disposition of a legacy portfolio of small-ticket
commercial real estate loans.
● Provision for Loan and Lease Losses: The provision for loan and lease losses decreased by $554 million in 2010, to $429 million.
The substantial reduction in the provision was attributable to improvements in charge-off and nonperforming loan rates
throughout the year, which resulted in a reduction in our allowance build. We recorded an allowance build of $41 million in 2010,
compared with an allowance build of $484 million in 2009.
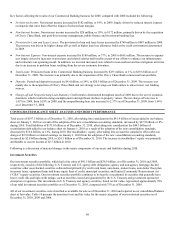
● Non-Interest Expense: Non-interest expense increased by $135 million, or 20%, in 2010 to $796 million. The increase was
attributable to higher loan workout expenses and losses related to REO, combined with increases in core deposit intangible
amortization expense, integration costs related to the Chevy Chase Bank acquisition and expenditures related to risk management
activities and enhancing our infrastructure.
● Total Loans: Period-end loans in the Commercial Banking business increased by $129 million, or less than 1%, to $29.7 billion as
of December 31, 2010. The slight increase was due to modest loan growth, which was partially offset by the disposition of the
legacy portfolio of small-ticket commercial real estate loans.
● Deposits: Period-end deposits increased by $2.1 billion, or 10%, to $22.6 billion as of December 31, 2010, driven by our
increased effort to build and expand commercial relationships.
● Charge-off and Nonperforming Loan Statistics: Credit metrics in our Commercial Banking business remain elevated, but have
significantly improved since the second half of 2009 as a result of the improved economic environment and our risk management
activities. The net charge-off rate decreased to 1.32% in 2010, from 1.45% in 2009. The nonperforming loan rate declined to
1.66% as of December 31, 2010, from 2.37% as of December 31, 2009.