Capital One 2010 Annual Report Download - page 110
Download and view the complete annual report
Please find page 110 of the 2010 Capital One annual report below. You can navigate through the pages in the report by either clicking on the pages listed below, or by using the keyword search tool below to find specific information within the annual report.-
 1
1 -
2
-
3
-
4
-
5
-
6
-
7
-
8
-
9
-
10
-
11
-
12
-
13
-
14
-
15
-
16
-
17
-
18
-
19
-
20
-
21
-
22
-
23
-
24
-
25
-
26
-
27
-
28
-
29
-
30
-
31
-
32
-
33
-
34
-
35
-
36
-
37
-
38
-
39
-
40
-
41
-
42
-
43
-
44
-
45
-
46
-
47
-
48
-
49
-
50
-
51
-
52
-
53
-
54
-
55
-
56
-
57
-
58
-
59
-
60
-
61
-
62
-
63
-
64
-
65
-
66
-
67
-
68
-
69
-
70
-
71
-
72
-
73
-
74
-
75
-
76
-
77
-
78
-
79
-
80
-
81
-
82
-
83
-
84
-
85
-
86
-
87
-
88
-
89
-
90
-
91
-
92
-
93
-
94
-
95
-
96
-
97
-
98
-
99
-
 100
100 -
 101
101 -
 102
102 -
 103
103 -
 104
104 -
 105
105 -
 106
106 -
 107
107 -
 108
108 -
 109
109 -
 110
110 -
 111
111 -
 112
112 -
 113
113 -
 114
114 -
 115
115 -
 116
116 -
 117
117 -
 118
118 -
 119
119 -
 120
120 -
121
-
122
-
123
-
124
-
125
-
126
-
127
-
128
-
129
-
130
-
131
-
132
-
133
-
134
-
135
-
136
-
137
-
138
-
139
-
140
-
141
-
142
-
143
-
144
-
145
-
146
-
147
-
148
-
149
-
150
-
151
-
152
-
153
-
154
-
155
-
156
-
157
-
158
-
159
-
160
-
161
-
162
-
163
-
164
-
165
-
166
-
167
-
168
-
169
-
170
-
171
-
172
-
173
-
174
-
175
-
176
-
177
-
178
-
179
-
180
-
181
-
182
-
183
-
184
-
185
-
186
-
187
-
188
-
189
-
190
-
191
-
192
-
193
-
194
-
195
-
196
-
197
-
198
-
199
-
200
-
201
-
202
-
203
-
204
-
205
-
206
-
207
-
208
-
209
-
210
-
211
-
212
-
213
-
214
-
215
-
216
-
217
-
218
-
219
-
220
-
221
-
222
-
223
-
224
-
225
-
226
 |
 |

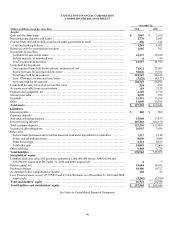
90
CAPITAL ONE FINANCIAL CORPORATION
CONSOLIDATED BALANCE SHEETS
December 31,
(Dollars in millions, except per share data) 2010 2009
Assets:
Cash and due from banks ....................................................................
.
$ 2,067 $ 3,100
Interest-bearing deposits with banks ..........................................................
.
2,776 5,043
Federal funds sold and securities purchased under agreements to resell ..........................
.
406 542
Cash and cash equivalents .................................................................
.
5,249 8,685
Restricted cash for securitization investors ....................................................
.
1,602 501
Investment in securities:
Available for sale, at fair value .............................................................
.
41,537 38,830
Held to maturity, at amortized cost .........................................................
.
0 80
Total investment in securities ..............................................................
.
41,537 38,910
Loans held for investment:
Unsecuritized loans held for investment, at amortized cost ....................................
.
71,921 75,097
Restricted loans for securitization investors .................................................
.
54,026 15,522
Total loans held for investment .............................................................
.
125,947 90,619
Less: Allowance for loan and lease losses ...................................................
.
(5,628) (4,127)
Net loans held for investment ..............................................................
.
120,319 86,492
Loans held for sale, at lower-of-cost-or-fair value ..............................................
.
228 268
Accounts receivable from securitizations ......................................................
.
118 7,128
Premises and equipment, net .................................................................
.
2,749 2,736
Interest receivable ...........................................................................
.
1,070 936
Goodwill ...................................................................................
.
13,591 13,596
Other ......................................................................................
.
11,040 10,394
Total assets ................................................................................
.
$ 197,503 $ 169,646
Liabilities:
Interest payable .............................................................................
.
$ 488 $ 509
Customer deposits
N
on-interest bearing deposits ................................................................
.
15,048 13,439
Interest bearing deposits .....................................................................
.
107,162 102,370
Total customer deposits .....................................................................
.
122,210 115,809
Securitized debt obligations ..................................................................
.
26,915 3,954
Other debt:
Federal funds purchased and securities loaned or sold under agreements to repurchase ..........
.
1,517 1,140
Senior and subordinated notes ..............................................................
.
8,650 9,045
Other borrowings .........................................................................
.
4,714 6,875
Total other debt ...........................................................................
.
14,881 17,060
Other liabilities .............................................................................
.
6,468 5,724
Total liabilities .............................................................................
.
170,962 143,056
Stockholders’ equity:
Common stock, par value $.01 per share; authorized 1,000,000,000 shares; 504,801,064 and
502,394,396 issued as of December 31, 2010 and 2009, respectively ..........................
.
5 5
Paid-in capital, net ..........................................................................
.
19,084 18,955
Retained earnings ...........................................................................
.
10,406 10,727
Accumulated other comprehensive income 248 83
Less: Treasury stock, at cost; 47,787,697 and 47,224,200 shares as of December 31, 2010 and 2009,
respectively ..............................................................................
.
(3,202) (3,180)
Total stockholders’ equity ..................................................................
.
26,541 26,590
Total liabilities and stockholders’ equity ....................................................
.
$ 197,503 $ 169,646
See Notes to Consolidated Financial Statements.