Capital One 2010 Annual Report Download - page 201
Download and view the complete annual report
Please find page 201 of the 2010 Capital One annual report below. You can navigate through the pages in the report by either clicking on the pages listed below, or by using the keyword search tool below to find specific information within the annual report.-
 1
1 -
2
-
3
-
4
-
5
-
6
-
7
-
8
-
9
-
10
-
11
-
12
-
13
-
14
-
15
-
16
-
17
-
18
-
19
-
20
-
21
-
22
-
23
-
24
-
25
-
26
-
27
-
28
-
29
-
30
-
31
-
32
-
33
-
34
-
35
-
36
-
37
-
38
-
39
-
40
-
41
-
42
-
43
-
44
-
45
-
46
-
47
-
48
-
49
-
50
-
51
-
52
-
53
-
54
-
55
-
56
-
57
-
58
-
59
-
60
-
61
-
62
-
63
-
64
-
65
-
66
-
67
-
68
-
69
-
70
-
71
-
72
-
73
-
74
-
75
-
76
-
77
-
78
-
79
-
80
-
81
-
82
-
83
-
84
-
85
-
86
-
87
-
88
-
89
-
90
-
91
-
92
-
93
-
94
-
95
-
96
-
97
-
98
-
99
-
100
-
101
-
102
-
103
-
104
-
105
-
106
-
107
-
108
-
109
-
110
-
111
-
112
-
113
-
114
-
115
-
116
-
117
-
118
-
119
-
120
-
121
-
122
-
123
-
124
-
125
-
126
-
127
-
128
-
129
-
130
-
131
-
132
-
133
-
134
-
135
-
136
-
137
-
138
-
139
-
140
-
141
-
142
-
143
-
144
-
145
-
146
-
147
-
148
-
149
-
150
-
151
-
152
-
153
-
154
-
155
-
156
-
157
-
158
-
159
-
160
-
161
-
162
-
163
-
164
-
165
-
166
-
167
-
168
-
169
-
170
-
171
-
172
-
173
-
174
-
175
-
176
-
177
-
178
-
179
-
180
-
181
-
182
-
183
-
184
-
185
-
186
-
187
-
188
-
189
-
190
-
 191
191 -
 192
192 -
 193
193 -
 194
194 -
 195
195 -
 196
196 -
 197
197 -
 198
198 -
 199
199 -
 200
200 -
 201
201 -
 202
202 -
 203
203 -
 204
204 -
 205
205 -
 206
206 -
 207
207 -
 208
208 -
 209
209 -
 210
210 -
 211
211 -
212
-
213
-
214
-
215
-
216
-
217
-
218
-
219
-
220
-
221
-
222
-
223
-
224
-
225
-
226
 |
 |

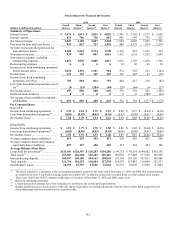
181
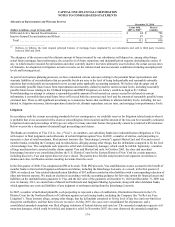
Selected Quarterly Financial Information
2010 2009
(Dollars in millions)(Unaudited) Fourth
Quarter
Third
Quarter(4)
Second
Quarter(4)
First
Quarter(4)
Fourth
Quarter Third
Quarter Second
Quarter
First
Quarter
Summary of Operations:
Interest income ....................... $ 3,674 $ 3,815 $ 3,835 $ 4,029 $ 2,595 $ 2,702 $ 2,717 $ 2,650
Interest expense ....................... 651 706 738 801 641 697 772 857
Net interest income ................... 3,023 3,109 3,097 3,228 1,954 2,005 1,945 1,793
Provision for loan and lease losses ...... 839 867 723 1,478 844 1,173 934 1,279
Net interest income after provision for
loan and lease losses ................ 2,184 2,242 2,374 1,750 1,110 832 1,011 514
Non-interest income ................... 939 907 807 1,061 1,412 1,552 1,232 1,090
Non-interest expense, excluding
restructuring expenses ............... 2,091 1,996 2,000 1,847 1,916 1,776 1,878 1,728
Restructuring expenses ................ 0 0 0 0 32 26 43 18
Income (loss) from continuing operations
before income taxes ................. 1,032 1,153 1,181 964 574 582 322 (142)
Income taxes ......................... 331 335 369 245 170 145 93 (59)
Income (loss) from continuing
operations, net of tax ................ 701 818 812 719 404 437 229 (83)
Loss from discontinued operations, net of
tax(2) ............................... (4) (15) (204) (84) (28 ) (44) (6) (25)
Net income (loss) ..................... 697 803 608 635 376 393 223 (108)
Preferred stock dividend ............... 0 0 0 0 0 0 (500) (64)
Net income (loss) available to common
stockholders ........................ $ 697 $ 803 $ 608 $ 635 $ 376 $ 393 $ (277) $ (172)
Per Common Share:
Basic EPS:
Income from continuing operations ..... $ 1.55 $ 1.81 $ 1.79 $ 1.59 $ 0.90 $ 0.97 $ (0.64) $ (0.38)
Loss from discontinued operations(2) .... (0.01) (0.03) (0.45) (0.18) (0.07 ) (0.09) (0.01) (0.06)
Net income (loss) ..................... $ 1.54 $ 1.78 $ 1.34 $ 1.41 $ 0.83 $ 0.88 $ (0.66) $ (0.44)
Diluted EPS:
Income from continuing operations ..... $ 1.53 $ 1.79 $ 1.78 $ 1.58 $ 0.89 $ 0.96 $ (0.64) $ (0.38)
Loss from discontinued operations(2) .... (0.01) (0.03) (0.45) (0.18) (0.06 ) (0.09) (0.01) (0.06)
Net income (loss) ..................... $ 1.52 $ 1.76 $ 1.33 $ 1.40 $ 0.83 $ 0.87 $ (0.66) $ (0.44)
Average common shares (millions) ..... 453 453 452 451 450 450 422 390
Average common shares and common
equivalent shares (millions) ......... 457 457 456 455 455 454 422 390
Average Balance Sheet Data:
Loans held for investment(3) ............ $ 125,441 $126,307 $ 128,203 $134,206 $ 94,732 $ 99,354 $ 104,682 $103,242
Total assets(3) ......................... 197,597 196,598 199,329 207,207 169,856 173,428 177,628 168,489
Interest-bearing deposits ............... 106,597 104,186 104,163 104,018 101,144 103,105 107,033 100,886
Total deposits ......................... 121,736 118,255 118,484 117,530 114,597 115,883 119,604 112,137
Stockholders’ equity .................. 26,255 25,307 24,526 23,681 26,518 26,002 27,668 27,004
________________________
(1) The above schedule is a tabulation of the our unaudited quarterly results for the years ended December 31, 2010 and 2009. Our common shares
are traded on the New York Stock Exchange under the symbol COF. In addition, shares may be traded in the over-the-counter stock market.
There were 14,981 and 16,955 common stockholders of record as of December 31, 2010 and 2009, respectively.
(2) Based on continuing operations.
(3) Certain prior period amounts have been reclassified to conform to the current period presentation.
(4) Results and balances have been recast to reflect the impact of purchase accounting adjustments from the Chevy Chase Bank acquisition as if
those adjustments had been recorded at the acquisition date.