Capital One 2010 Annual Report Download - page 72
Download and view the complete annual report
Please find page 72 of the 2010 Capital One annual report below. You can navigate through the pages in the report by either clicking on the pages listed below, or by using the keyword search tool below to find specific information within the annual report.-
 1
1 -
2
-
3
-
4
-
5
-
6
-
7
-
8
-
9
-
10
-
11
-
12
-
13
-
14
-
15
-
16
-
17
-
18
-
19
-
20
-
21
-
22
-
23
-
24
-
25
-
26
-
27
-
28
-
29
-
30
-
31
-
32
-
33
-
34
-
35
-
36
-
37
-
38
-
39
-
40
-
41
-
42
-
43
-
44
-
45
-
46
-
47
-
48
-
49
-
50
-
51
-
52
-
53
-
54
-
55
-
56
-
57
-
58
-
59
-
60
-
61
-
 62
62 -
 63
63 -
 64
64 -
 65
65 -
 66
66 -
 67
67 -
 68
68 -
 69
69 -
 70
70 -
 71
71 -
 72
72 -
 73
73 -
 74
74 -
 75
75 -
 76
76 -
 77
77 -
 78
78 -
 79
79 -
 80
80 -
 81
81 -
 82
82 -
83
-
84
-
85
-
86
-
87
-
88
-
89
-
90
-
91
-
92
-
93
-
94
-
95
-
96
-
97
-
98
-
99
-
100
-
101
-
102
-
103
-
104
-
105
-
106
-
107
-
108
-
109
-
110
-
111
-
112
-
113
-
114
-
115
-
116
-
117
-
118
-
119
-
120
-
121
-
122
-
123
-
124
-
125
-
126
-
127
-
128
-
129
-
130
-
131
-
132
-
133
-
134
-
135
-
136
-
137
-
138
-
139
-
140
-
141
-
142
-
143
-
144
-
145
-
146
-
147
-
148
-
149
-
150
-
151
-
152
-
153
-
154
-
155
-
156
-
157
-
158
-
159
-
160
-
161
-
162
-
163
-
164
-
165
-
166
-
167
-
168
-
169
-
170
-
171
-
172
-
173
-
174
-
175
-
176
-
177
-
178
-
179
-
180
-
181
-
182
-
183
-
184
-
185
-
186
-
187
-
188
-
189
-
190
-
191
-
192
-
193
-
194
-
195
-
196
-
197
-
198
-
199
-
200
-
201
-
202
-
203
-
204
-
205
-
206
-
207
-
208
-
209
-
210
-
211
-
212
-
213
-
214
-
215
-
216
-
217
-
218
-
219
-
220
-
221
-
222
-
223
-
224
-
225
-
226
 |
 |

52
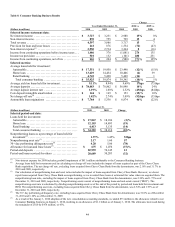
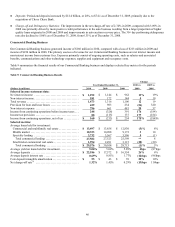
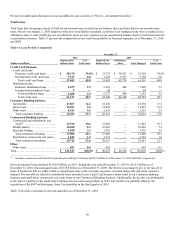
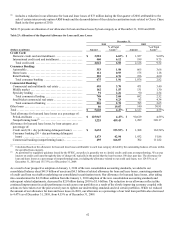
Consumer Banking represented $34.4 billion, or 27% of our loan portfolio as of December 31, 2010, down from 28% as of December
31, 2009. The automobile portfolio was originated primarily on a national basis, with additional originations through the retail branch
network. It is well diversified with some concentration in Texas, California and Louisiana. The home loan portfolio is concentrated in
New York, California and Louisiana which reflects the characteristics of the legacy Hibernia, North Fork and Chevy Chase Bank
portfolios that comprise the majority of our home loans. Other retail lending includes our branch and banker based small business
loans as well as other consumer lending products originated through the branch network. These portfolios are concentrated in our
retail branch geographies. See “Table 14—Consumer Banking Concentrations (Managed)” for further details.
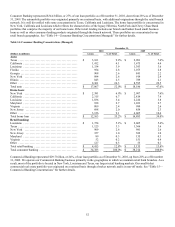
Table 14: Consumer Banking Concentrations (Managed)
December 31,
2010 2009
(Dollars in millions) Loans % of Total Loans % of Total
Auto:
Texas ................................................ $ 3,161 9.2% $ 2,901 7.6%
California ............................................ 1,412 4.1 1,675 4.4
Louisiana ............................................ 1,334 3.9 1,393 3.6
Florida .............................................. 954 2.8 1,073 2.8
Georgia .............................................. 908 2.6 841 2.2
N
ew Yor
k
........................................... 894 2.6 919 2.4
Illinois ............................................... 843 2.5 789 2.1
Other ................................................ 8,361 24.3 8,595 22.5
Total auto ............................................ $ 17,867 52.0% $ 18,186 47.6%
Home loan:
N
ew Yor
k
........................................... $ 2,381 6.9% $ 2,907 7.6%
California ............................................ 2,315 6.7 2,814 7.4
Louisiana ............................................ 1,836 5.4 2,226 5.8
Maryland ............................................ 938 2.7 1,033 2.7
Virginia ............................................. 809 2.4 989 2.6
N
ew Jersey .......................................... 698 2.0 859 2.3
Other ................................................ 3,126 9.1 4,065 10.6
Total home loan ...................................... $ 12,103 35.2% $ 14,893 39.0%
Retail banking:
Louisiana ............................................ $ 1,754 5.1% $ 2,065 5.4%
Texas ................................................ 1,125 3.3 1,366 3.6
N
ew Yor
k
........................................... 909 2.6 981 2.6
N
ew Jersey .......................................... 357 1.0 382 1.0
Maryland ............................................ 89 0.3 135 0.3
Virginia ............................................. 52 0.2 151 0.4
Other ................................................ 127 0.3 55 0.1
Total retail banking ................................... $ 4,413 12.8% $ 5,135 13.4%
Total consumer banking ............................... $ 34,383 100.0% $ 38,214 100.0%
Commercial Banking represented $29.7 billion, or 24%, of our loan portfolio as of December 31, 2010, up from 22% as of December
31, 2009. We operate our Commercial Banking business primarily in the geographies in which we maintain retail bank branches. As a
result, most of the portfolio is located in New York, Louisiana and Texas, our largest retail banking markets. Our small-ticket
commercial real estate portfolio was originated on a national basis through a broker network and is in run-off mode. See “Table 15—
Commercial Banking Concentrations” for further details.