Capital One 2010 Annual Report Download - page 70
Download and view the complete annual report
Please find page 70 of the 2010 Capital One annual report below. You can navigate through the pages in the report by either clicking on the pages listed below, or by using the keyword search tool below to find specific information within the annual report.-
 1
1 -
2
-
3
-
4
-
5
-
6
-
7
-
8
-
9
-
10
-
11
-
12
-
13
-
14
-
15
-
16
-
17
-
18
-
19
-
20
-
21
-
22
-
23
-
24
-
25
-
26
-
27
-
28
-
29
-
30
-
31
-
32
-
33
-
34
-
35
-
36
-
37
-
38
-
39
-
40
-
41
-
42
-
43
-
44
-
45
-
46
-
47
-
48
-
49
-
50
-
51
-
52
-
53
-
54
-
55
-
56
-
57
-
58
-
59
-
 60
60 -
 61
61 -
 62
62 -
 63
63 -
 64
64 -
 65
65 -
 66
66 -
 67
67 -
 68
68 -
 69
69 -
 70
70 -
 71
71 -
 72
72 -
 73
73 -
 74
74 -
 75
75 -
 76
76 -
 77
77 -
 78
78 -
 79
79 -
 80
80 -
81
-
82
-
83
-
84
-
85
-
86
-
87
-
88
-
89
-
90
-
91
-
92
-
93
-
94
-
95
-
96
-
97
-
98
-
99
-
100
-
101
-
102
-
103
-
104
-
105
-
106
-
107
-
108
-
109
-
110
-
111
-
112
-
113
-
114
-
115
-
116
-
117
-
118
-
119
-
120
-
121
-
122
-
123
-
124
-
125
-
126
-
127
-
128
-
129
-
130
-
131
-
132
-
133
-
134
-
135
-
136
-
137
-
138
-
139
-
140
-
141
-
142
-
143
-
144
-
145
-
146
-
147
-
148
-
149
-
150
-
151
-
152
-
153
-
154
-
155
-
156
-
157
-
158
-
159
-
160
-
161
-
162
-
163
-
164
-
165
-
166
-
167
-
168
-
169
-
170
-
171
-
172
-
173
-
174
-
175
-
176
-
177
-
178
-
179
-
180
-
181
-
182
-
183
-
184
-
185
-
186
-
187
-
188
-
189
-
190
-
191
-
192
-
193
-
194
-
195
-
196
-
197
-
198
-
199
-
200
-
201
-
202
-
203
-
204
-
205
-
206
-
207
-
208
-
209
-
210
-
211
-
212
-
213
-
214
-
215
-
216
-
217
-
218
-
219
-
220
-
221
-
222
-
223
-
224
-
225
-
226
 |
 |

50
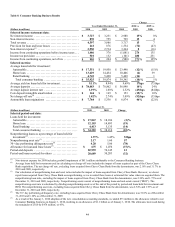
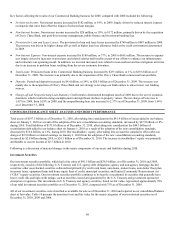
We provide additional information on our available-for-sale securities in “Note 4—Investment Securities.”
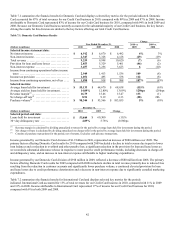
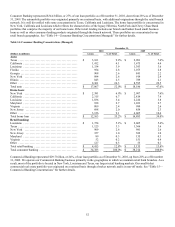
Total Loans
Total loans that we manage consist of held-for-investment loans recorded on our balance sheet and loans held in our securitization
trusts. Prior to our January 1, 2010 adoption of the new consolidation standards, a portion of our managed loans were accounted for as
off-balance sheet. Loans underlying our securitization trusts are now reported on our consolidated balance sheets in restricted loans for
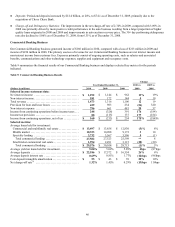
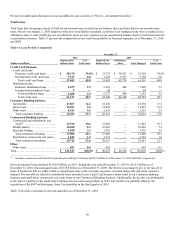
securitization investors. Table 11 presents the composition of our total loan portfolio, by business segments, as of December 31, 2010
and 2009.
Table 11: Loan Portfolio Composition
December 31,
2010 2009
(Dollars in millions) Reported On-
Balance Sheet % of
Total Loans Reported On-
Balance Sheet Off-Balance
Sheet Total Managed % of
Total Loans
Credit Card business:
Credit card loans:
Domestic credit card loans ........ $ 50,170 39.8% $ 13,374 $ 39,827 $ 53,201 38.9%
International credit card loans ..... 7,513 6.0 2,229 5,951 8,180 6.0
Total credit card loans .......... 57,683 45.8 15,603 45,778 61,381 44.9
Installment loans:
Domestic installment loans ....... 3,679 2.9 6,693 406 7,099 5.2
International installment loans .... 9
—
44
—
44
—
Total installment loans ......... 3,688 2.9 6,737 406 7,143 5.2
Total credit card ............... 61,371 48.7 22,340 46,184 68,524 50.1
Consumer Banking business:
Automobile ........................ 17,867 14.2 18,186
—
18,186 13.3
Home loans ....................... 12,103 9.6 14,893
—
14,893 10.9
Other retail ........................ 4,413 3.5 5,135
—
5,135 3.7
Total consumer banking .......... 34,383 27.3 38,214
—
38,214 27.9
Commercial Banking business:
Commercial and multifamily real
estate(1) .......................... 13,396 10.6 13,843
—
13,843 10.1
Middle market ..................... 10,484 8.3 10,062
—
10,062 7.4
Specialty lending .................. 4,020 3.2 3,555
—
3,555 2.6
Total commercial lending ......... 27,900 22.1 27,460
—
27,460 20.1
Small-ticket commercial real estate . . 1,842 1.5 2,153
—
2,153 1.6
Total commercial banking ........ 29,742 23.6 29,613
—
29,613 21.7
Other:
Other loans ........................ 451 0.4 452
—
452 0.3
Total ................................. $ 125,947 100.0% $ 90,619 $ 46,184 $ 136,803 100.0%
________________________
(1) Includes construction and land development loans totaling $2.4 billion and $2.5 billion as of December 31, 2010 and 2009, respectively.
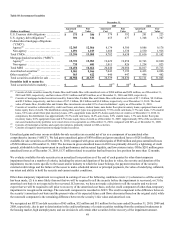
Our total reported loans declined by $10.9 billion, or 8.0%, during the year ended December 31, 2010 to $125.9 billion as of
December 31, 2010, from managed loans of $136.8 billion as of December 31, 2009. The decline was primarily due to the run-off of
loans in businesses that we either exited or repositioned early in the economic recession, elevated charge-offs and weak consumer
demand. The run-offs are related to installment loans included in our Credit Card business, home loans in our Consumer Banking
business and small-ticket commercial real estate loans in our Commercial Banking business. Additionally, the decline was attributable
to the sale of a portion of the small-ticket commercial real estate loan portfolio in 2010. The decline was partially offset by the
acquisition of the $807 million legacy Sony Card portfolio in the third quarter of 2010.
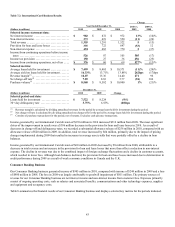
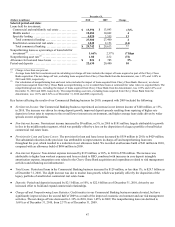
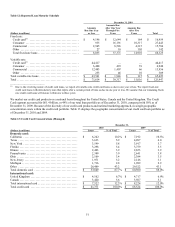
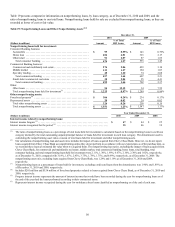
Table 12 presents a schedule of our loan maturities as of December 31, 2010.