Capital One 2010 Annual Report Download - page 74
Download and view the complete annual report
Please find page 74 of the 2010 Capital One annual report below. You can navigate through the pages in the report by either clicking on the pages listed below, or by using the keyword search tool below to find specific information within the annual report.-
 1
1 -
2
-
3
-
4
-
5
-
6
-
7
-
8
-
9
-
10
-
11
-
12
-
13
-
14
-
15
-
16
-
17
-
18
-
19
-
20
-
21
-
22
-
23
-
24
-
25
-
26
-
27
-
28
-
29
-
30
-
31
-
32
-
33
-
34
-
35
-
36
-
37
-
38
-
39
-
40
-
41
-
42
-
43
-
44
-
45
-
46
-
47
-
48
-
49
-
50
-
51
-
52
-
53
-
54
-
55
-
56
-
57
-
58
-
59
-
60
-
61
-
62
-
63
-
 64
64 -
 65
65 -
 66
66 -
 67
67 -
 68
68 -
 69
69 -
 70
70 -
 71
71 -
 72
72 -
 73
73 -
 74
74 -
 75
75 -
 76
76 -
 77
77 -
 78
78 -
 79
79 -
 80
80 -
 81
81 -
 82
82 -
 83
83 -
 84
84 -
85
-
86
-
87
-
88
-
89
-
90
-
91
-
92
-
93
-
94
-
95
-
96
-
97
-
98
-
99
-
100
-
101
-
102
-
103
-
104
-
105
-
106
-
107
-
108
-
109
-
110
-
111
-
112
-
113
-
114
-
115
-
116
-
117
-
118
-
119
-
120
-
121
-
122
-
123
-
124
-
125
-
126
-
127
-
128
-
129
-
130
-
131
-
132
-
133
-
134
-
135
-
136
-
137
-
138
-
139
-
140
-
141
-
142
-
143
-
144
-
145
-
146
-
147
-
148
-
149
-
150
-
151
-
152
-
153
-
154
-
155
-
156
-
157
-
158
-
159
-
160
-
161
-
162
-
163
-
164
-
165
-
166
-
167
-
168
-
169
-
170
-
171
-
172
-
173
-
174
-
175
-
176
-
177
-
178
-
179
-
180
-
181
-
182
-
183
-
184
-
185
-
186
-
187
-
188
-
189
-
190
-
191
-
192
-
193
-
194
-
195
-
196
-
197
-
198
-
199
-
200
-
201
-
202
-
203
-
204
-
205
-
206
-
207
-
208
-
209
-
210
-
211
-
212
-
213
-
214
-
215
-
216
-
217
-
218
-
219
-
220
-
221
-
222
-
223
-
224
-
225
-
226
 |
 |

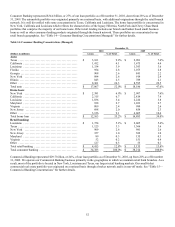
54
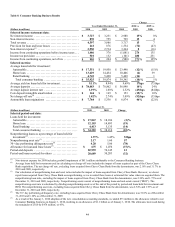
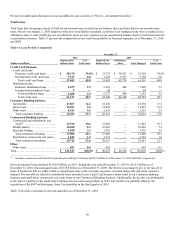
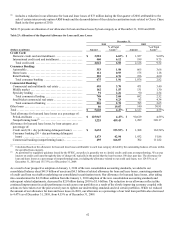
Table 16: 30+ Day Performing Delinquencies
December 31,
2010 2009
(Dollars in millions) Amount Rate Amount Rate
Credit Card business:
Domestic credit card and installment .......................
.
$ 2,200 4.09% $ 3,487 5.78%
International credit card and installment ....................
.
432 5.75 539 6.55
Total credit card .......................................
.
2,632 4.29 4,026 5.88
Consumer Banking business:
Automobile ..............................................
.
1,355 7.58 1,681 9.24
Home loans(1) ............................................
.
77 0.64 188 1.26
Retail banking(1) .........................................
.
41 0.93 63 1.23
Total consumer banking(1) ..............................
.
1,473 4.28 1,932 5.06
Commercial Banking business:
Commercial and multifamily real estate(1) ..................
.
147 1.10 84 0.61
Middle market(1) .........................................
.
28 0.27 46 0.46
Specialty lending ........................................
.
33 0.81 60 1.69
Small-ticket commercial real estate ........................
.
95 5.17 121 5.59
Total commercial banking(1) ............................
.
303 1.02 311 1.05
Other:
Other loans ..............................................
.
22 4.75 53 11.60
Total ......................................................
.
$ 4,430 3.52% $ 6,322 4.62%
________________________
(1) The 30+ day performing delinquency rate, excluding the impact of loans acquired from Chevy Chase Bank from the denominator, for home
loans, retail banking, total consumer banking, commercial and multifamily real estate, middle market, and total commercial banking was 1.06%,
0.97%, 5.35%, 1.12%, 0.28% and 1.04%, respectively, as of December 31, 2010, compared with 2.18%, 1.30%, 6.56%, 0.63%, 0.47% and
1.08%, respectively, as of December 31, 2009.
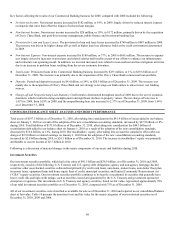
Delinquency rates for all loan categories, except commercial and multifamily real estate, showed signs of improvement during 2010,
reflecting positive trends in credit conditions. In addition, the diminishing initial adverse impact from the pricing changes we made
during 2009 contributed to a reduction in the delinquency rate for domestic credit cards.
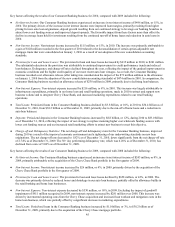
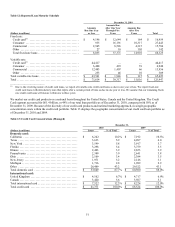
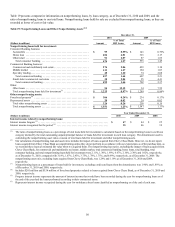
Table 17 presents an aging of 30+ day performing delinquent loans included in the above table. All loans included are on accrual
status.
Table 17: Aging of 30+ Day Performing Delinquent Loans
December 31,
2010 2009 2008
(Dollars in millions) Amount
% of
Total Loans Amount
% of
Total Loans Amount
% of
Total Loans
Total loan portfolio ..................... $ 125,947 100.00% $ 136,803 100.00% $ 146,937 100.00%
Delinquency status:
30 – 59 days .......................... $ 1,968 1.56% $ 2,623 1.92% $ 2,987 2.03 %
60 – 89 days .......................... 1,064 0.84 1,576 1.15 1,582 1.08
90 – 119 days ......................... 559 0.44 895 0.65 817 0.60
120 – 149 days ........................ 446 0.35 660 0.48 569 0.39
150 + days ........................... 393 0.31 568 0.42 476 0.32
Total ............................... $ 4,430 3.52% $ 6,322 4.62% $ 6,431 4.38%
Geographic region:
Domestic ............................. $ 3,998 3.38% $ 5,783 4.23% $ 5,915 4.03%
International .......................... 432 5.75 539 6.55 516 5.92
Total ............................... $ 4,430 3.52% $ 6,322 4.62% $ 6,431 4.38%
90+ day performing delinquent loans(1) ... $ 1,398 1.11% $ 2,123 1.55% $ 1,862 1.27%
________________________
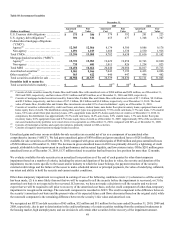
(1) Includes credit card loans that continue to accrue finance charges and fees until charged-off at 180 days. The amounts reported for credit card
loans are net of billed finance charges and fees that we do not expect to collect. In accordance with our finance charge and fee revenue
recognition policy, amounts billed but not included in revenue totaled $950 million, $2.1 billion and $1.9 billion in 2010, 2009 and 2008,
respectively. Credit card loans 90 days or greater past due which continue to accrue interest totaled $1.4 billion, $2.1 billion and $1.9 billion as
of December 31, 2010, 2009 and 2008, respectively.