Capital One 2010 Annual Report Download - page 39
Download and view the complete annual report
Please find page 39 of the 2010 Capital One annual report below. You can navigate through the pages in the report by either clicking on the pages listed below, or by using the keyword search tool below to find specific information within the annual report.-
 1
1 -
2
-
3
-
4
-
5
-
6
-
7
-
8
-
9
-
10
-
11
-
12
-
13
-
14
-
15
-
16
-
17
-
18
-
19
-
20
-
21
-
22
-
23
-
24
-
25
-
26
-
27
-
28
-
 29
29 -
 30
30 -
 31
31 -
 32
32 -
 33
33 -
 34
34 -
 35
35 -
 36
36 -
 37
37 -
 38
38 -
 39
39 -
 40
40 -
 41
41 -
 42
42 -
 43
43 -
 44
44 -
 45
45 -
 46
46 -
 47
47 -
 48
48 -
 49
49 -
50
-
51
-
52
-
53
-
54
-
55
-
56
-
57
-
58
-
59
-
60
-
61
-
62
-
63
-
64
-
65
-
66
-
67
-
68
-
69
-
70
-
71
-
72
-
73
-
74
-
75
-
76
-
77
-
78
-
79
-
80
-
81
-
82
-
83
-
84
-
85
-
86
-
87
-
88
-
89
-
90
-
91
-
92
-
93
-
94
-
95
-
96
-
97
-
98
-
99
-
100
-
101
-
102
-
103
-
104
-
105
-
106
-
107
-
108
-
109
-
110
-
111
-
112
-
113
-
114
-
115
-
116
-
117
-
118
-
119
-
120
-
121
-
122
-
123
-
124
-
125
-
126
-
127
-
128
-
129
-
130
-
131
-
132
-
133
-
134
-
135
-
136
-
137
-
138
-
139
-
140
-
141
-
142
-
143
-
144
-
145
-
146
-
147
-
148
-
149
-
150
-
151
-
152
-
153
-
154
-
155
-
156
-
157
-
158
-
159
-
160
-
161
-
162
-
163
-
164
-
165
-
166
-
167
-
168
-
169
-
170
-
171
-
172
-
173
-
174
-
175
-
176
-
177
-
178
-
179
-
180
-
181
-
182
-
183
-
184
-
185
-
186
-
187
-
188
-
189
-
190
-
191
-
192
-
193
-
194
-
195
-
196
-
197
-
198
-
199
-
200
-
201
-
202
-
203
-
204
-
205
-
206
-
207
-
208
-
209
-
210
-
211
-
212
-
213
-
214
-
215
-
216
-
217
-
218
-
219
-
220
-
221
-
222
-
223
-
224
-
225
-
226
 |
 |
19
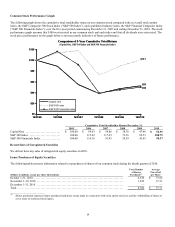
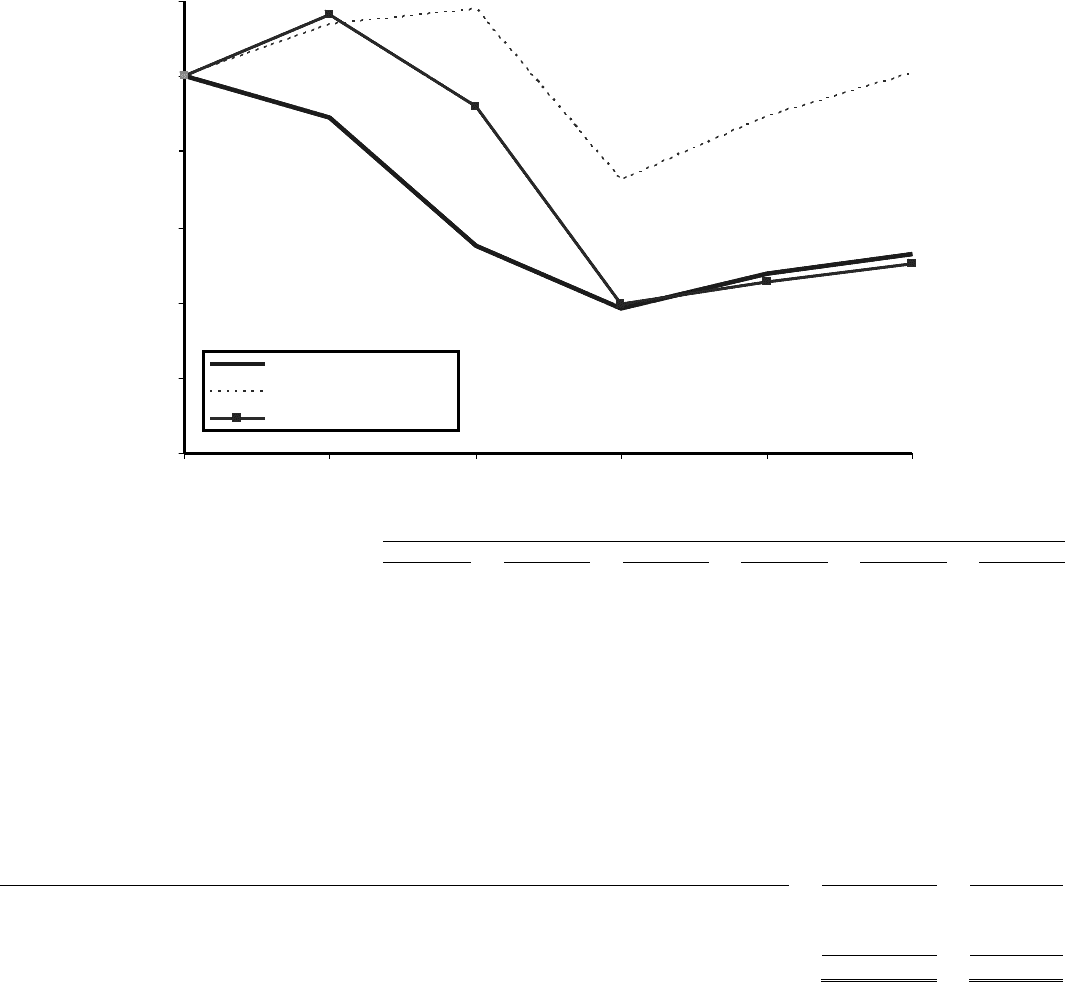
Common Stock Performance Graph
The following graph shows the cumulative total stockholder return on our common stock compared with an overall stock market
index, the S&P Composite 500 Stock Index (“S&P 500 Index”), and a published industry index, the S&P Financial Composite Index
(“S&P 500 Financials Index”), over the five-year period commencing December 31, 2005 and ending December 31, 2010. The stock
performance graph assumes that $100 was invested in our common stock and each index and that all dividends were reinvested. The
stock price performance on the graph below is not necessarily indicative of future performance.
Cumulative Total Stockholder Return December 31,
2005 2006 2007 2008 2009 2010
Capital One ............................ $ 100.00 $ 89.03 $ 54.86 $ 38.30 $ 47.46 $ 52.95
S&P 500 Index ......................... 100.00 113.62 117.63 72.36 89.33 100.75
S&P 500 Financials Index ............... 100.00 116.16 91.95 39.59 45.45 50.37
Recent Sales of Unregistered Securities
We did not have any sales of unregistered equity securities in 2010.
Issuer Purchases of Equity Securities
The following table presents information related to repurchases of shares of our common stock during the fourth quarter of 2010.
(Dollars in millions, except per share information)
Total Number
of Shares
Purchased(1)
Average
Price Paid
per Share
October 1-31, 2010 ......................................................................... 6,670 $ 37.82
N
ovember 1-30, 2010 ...................................................................... 1,832 37.31
December 1-31, 2010 ......................................................................
—
—
Total ...................................................................................... 8,502 $ 37.71
________________________
(1) Shares purchased represent shares purchased and share swaps made in connection with stock option exercises and the withholding of shares to
cover taxes on restricted stock lapses.
$53
$101
$0
$20
$40
$60
$80
$100
$120
12/31/05
Capital One
S&P 500 Index
S&P 500 Financials Index
$50
Comparison of 5-Year Cumulative Total Return
(Capital One, S&P 500 Index and S&P 500 Financials Index)
12/31/06 12/31/07 12/31/08 12/31/09 12/31/10
$53
$101
$0
$20
$40
$60
$80
$100
$120
12/31/05
Capital One
S&P 500 Index
S&P 500 Financials Index
$50
Comparison of 5-Year Cumulative Total Return
(Capital One, S&P 500 Index and S&P 500 Financials Index)
12/31/06 12/31/07 12/31/08 12/31/09 12/31/10