Capital One 2010 Annual Report Download - page 61
Download and view the complete annual report
Please find page 61 of the 2010 Capital One annual report below. You can navigate through the pages in the report by either clicking on the pages listed below, or by using the keyword search tool below to find specific information within the annual report.-
 1
1 -
2
-
3
-
4
-
5
-
6
-
7
-
8
-
9
-
10
-
11
-
12
-
13
-
14
-
15
-
16
-
17
-
18
-
19
-
20
-
21
-
22
-
23
-
24
-
25
-
26
-
27
-
28
-
29
-
30
-
31
-
32
-
33
-
34
-
35
-
36
-
37
-
38
-
39
-
40
-
41
-
42
-
43
-
44
-
45
-
46
-
47
-
48
-
49
-
50
-
 51
51 -
 52
52 -
 53
53 -
 54
54 -
 55
55 -
 56
56 -
 57
57 -
 58
58 -
 59
59 -
 60
60 -
 61
61 -
 62
62 -
 63
63 -
 64
64 -
 65
65 -
 66
66 -
 67
67 -
 68
68 -
 69
69 -
 70
70 -
 71
71 -
72
-
73
-
74
-
75
-
76
-
77
-
78
-
79
-
80
-
81
-
82
-
83
-
84
-
85
-
86
-
87
-
88
-
89
-
90
-
91
-
92
-
93
-
94
-
95
-
96
-
97
-
98
-
99
-
100
-
101
-
102
-
103
-
104
-
105
-
106
-
107
-
108
-
109
-
110
-
111
-
112
-
113
-
114
-
115
-
116
-
117
-
118
-
119
-
120
-
121
-
122
-
123
-
124
-
125
-
126
-
127
-
128
-
129
-
130
-
131
-
132
-
133
-
134
-
135
-
136
-
137
-
138
-
139
-
140
-
141
-
142
-
143
-
144
-
145
-
146
-
147
-
148
-
149
-
150
-
151
-
152
-
153
-
154
-
155
-
156
-
157
-
158
-
159
-
160
-
161
-
162
-
163
-
164
-
165
-
166
-
167
-
168
-
169
-
170
-
171
-
172
-
173
-
174
-
175
-
176
-
177
-
178
-
179
-
180
-
181
-
182
-
183
-
184
-
185
-
186
-
187
-
188
-
189
-
190
-
191
-
192
-
193
-
194
-
195
-
196
-
197
-
198
-
199
-
200
-
201
-
202
-
203
-
204
-
205
-
206
-
207
-
208
-
209
-
210
-
211
-
212
-
213
-
214
-
215
-
216
-
217
-
218
-
219
-
220
-
221
-
222
-
223
-
224
-
225
-
226
 |
 |
41
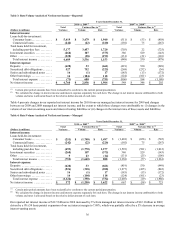
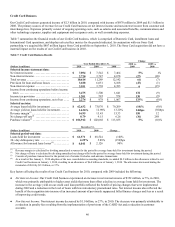
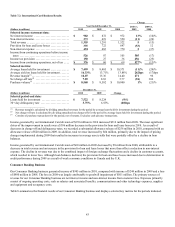
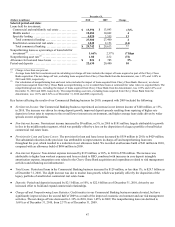
● Provision for Loan and Lease Losses: The provision for loan and lease losses related to our Credit Card business decreased by
$2.9 billion in 2010, to $3.2 billion. The substantial reduction in the provision was driven by improved credit trends, as evidenced
by a reduction in the net charge-off rate and a decrease and stabilization of delinquency rates throughout the year, as well as lower
period-end loan balances. As a result of the more positive credit performance trends and reduced loan balances, the Credit Card
business recorded a net allowance release (after taking into consideration the $4.2 billion addition to the allowance on January 1,
2010 from the adoption of the new consolidation accounting standards) of $2.3 billion in 2010. In comparison, our Credit Card
business recorded an allowance release of $611 million in 2009. The release in 2009 was driven by the reduction in period-end
loans, which more than offset the impact of the continued deterioration in the credit performance of our credit card portfolio due
to the severe economic downturn.
● Non-Interest Expense: Non-interest expense increased by $212 million, or 6%, in 2010. The increase reflects the impact of an
increase in marketing expenses, which has been partially offset by a decrease in operating expenses due to the reduction in
customer accounts and targeted cost savings across our Credit Card business. As the economy gradually improved, we increased
our marketing expenditures during 2010 from suppressed levels in 2009 to attract and support new business volume through a
variety of channels.
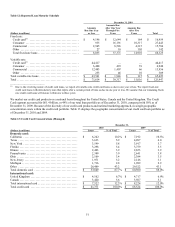
● Total Loans: Period-end loans in the Credit Card business declined by $7.2 billion, or 10%, in 2010, to $61.4 billion as of
December 31, 2010, from $68.5 billion as of December 31, 2009. Approximately $3.2 billion of the decrease was due to the run-
off of installment loans in our Domestic Card division. The remaining decrease, which was partially offset by the addition of the
Sony Card portfolio, was attributable to elevated net charge-offs, weak consumer demand and historically lower marketing
expenditures in 2009 and 2010 as result of the severe economic downturn.
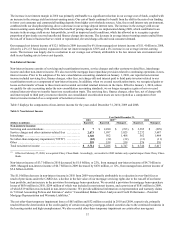
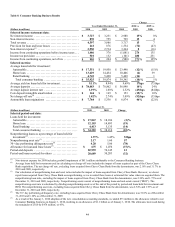
● Charge-off and Delinquency Statistics: Although net charge-off and delinquency rates remain elevated, these rates continued to
improve throughout 2010. The net charge-off rate decreased to 8.79% in 2010, from 9.15% in 2009. The 30+ day delinquency
rate decreased to 4.29% as of December 31, 2010, from 5.88% as of December 31, 2009. Based on continued improvement and
stabilization of credit performance, we believe net charge-offs for our Credit Card business resulting from the severe economic
downturn peaked in the first quarter of 2010.
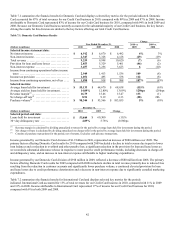
Key factors affecting the results of our Credit Card business for 2009, compared with 2008 included the following:
● Net Interest Income: Our Credit Card business experienced a modest increase in net interest income of $78 million, or 1%, in
2009, as higher interest margins slightly offset the reduction in net interest income attributable to declining loan balances.
● Non-Interest Income: Non-interest income decreased by $931 million, or 20%, to $3.7 billion, primarily due to lower fees as a
result of a reduction in customer accounts and significantly lower purchase volume. The severe economic downturn led to a
contraction in consumer spending, which reduced overlimit fee income.
● Provision for Loan and Lease Losses: The provision for loan and lease losses related to our Credit Card business of $6.1 billion in
2009 remained elevated at relatively the same level as 2008, reflecting the impact of continued weak credit performance in 2009
due to the severe economic downturn that began in 2008. Despite the elevated provision, we recorded an allowance release of
$611 million in 2009 driven by the reduction in period-end loans.
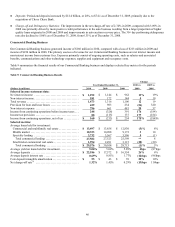
● Non-Interest Expense: Non-interest expense decreased by $665 million, or 15%, in 2009. This decrease was driven by a
substantial reduction in marketing expenses, by more than half, attributable to the severe economic downturn and lower operating
expenses. The reduction in operating expenses reflected the impact of favorable exchange in our U.K. and the run-off of our
closed-end loan portfolio.
● Total Loans: Period-end loans in the Credit Card business declined by $11.2 billion, or 14%, in 2009, to $68.5 billion as of
December 31, 2009. Approximately 43% of the decline was attributable to the run-off of the closed end loan portfolio. The
remaining decline was driven by reduced purchase volume in our revolving credit card businesses and elevated net charge-offs.
We added fewer new customer accounts during 2009 and existing customers maintained lower balances, partially attributable to
the curtailment of our marketing expenditures during 2009 as well as the uncertain economic environment.
● Charge-off and Delinquency Statistics: The substantial increase in the net charge-off rate to 9.15% in 2009, from 6.26% in 2008
was attributable to the significant deterioration in credit performance as a result of the severe economic downturn that began in
2008, which resulted in rising unemployment and higher loan default rates throughout 2009. Virtually all of our credit metrics
were adversely affected by economic conditions, including the 30+ day delinquency rate, which increased to 5.88% as of
December 31, 2009, from 4.86% as of December 31, 2008.