Capital One 2010 Annual Report Download - page 155
Download and view the complete annual report
Please find page 155 of the 2010 Capital One annual report below. You can navigate through the pages in the report by either clicking on the pages listed below, or by using the keyword search tool below to find specific information within the annual report.-
 1
1 -
2
-
3
-
4
-
5
-
6
-
7
-
8
-
9
-
10
-
11
-
12
-
13
-
14
-
15
-
16
-
17
-
18
-
19
-
20
-
21
-
22
-
23
-
24
-
25
-
26
-
27
-
28
-
29
-
30
-
31
-
32
-
33
-
34
-
35
-
36
-
37
-
38
-
39
-
40
-
41
-
42
-
43
-
44
-
45
-
46
-
47
-
48
-
49
-
50
-
51
-
52
-
53
-
54
-
55
-
56
-
57
-
58
-
59
-
60
-
61
-
62
-
63
-
64
-
65
-
66
-
67
-
68
-
69
-
70
-
71
-
72
-
73
-
74
-
75
-
76
-
77
-
78
-
79
-
80
-
81
-
82
-
83
-
84
-
85
-
86
-
87
-
88
-
89
-
90
-
91
-
92
-
93
-
94
-
95
-
96
-
97
-
98
-
99
-
100
-
101
-
102
-
103
-
104
-
105
-
106
-
107
-
108
-
109
-
110
-
111
-
112
-
113
-
114
-
115
-
116
-
117
-
118
-
119
-
120
-
121
-
122
-
123
-
124
-
125
-
126
-
127
-
128
-
129
-
130
-
131
-
132
-
133
-
134
-
135
-
136
-
137
-
138
-
139
-
140
-
141
-
142
-
143
-
144
-
 145
145 -
 146
146 -
 147
147 -
 148
148 -
 149
149 -
 150
150 -
 151
151 -
 152
152 -
 153
153 -
 154
154 -
 155
155 -
 156
156 -
 157
157 -
 158
158 -
 159
159 -
 160
160 -
 161
161 -
 162
162 -
 163
163 -
 164
164 -
 165
165 -
166
-
167
-
168
-
169
-
170
-
171
-
172
-
173
-
174
-
175
-
176
-
177
-
178
-
179
-
180
-
181
-
182
-
183
-
184
-
185
-
186
-
187
-
188
-
189
-
190
-
191
-
192
-
193
-
194
-
195
-
196
-
197
-
198
-
199
-
200
-
201
-
202
-
203
-
204
-
205
-
206
-
207
-
208
-
209
-
210
-
211
-
212
-
213
-
214
-
215
-
216
-
217
-
218
-
219
-
220
-
221
-
222
-
223
-
224
-
225
-
226
 |
 |

CAPITAL ONE FINANCIAL CORPORATION
NOTES TO CONSOLIDATED STATEMENTS
135
Based on the comparison of fair value to carrying amount, as calculated using the methodology summarized above, fair value
exceeded the carrying amount for all reporting units as of our annual testing date. Therefore, the goodwill of our reporting units was
considered not impaired, and the second step of impairment testing was unnecessary. However, assuming all other factors were held
constant, a 34% decline in the fair value of the Domestic Card reporting unit, a 14% decline in the fair value of the International Card
reporting unit, a 37% decline in the fair value of the Auto Finance reporting unit, a 21% decline in the fair value of the other
Consumer Banking and a 30% decline in the fair value of the other Commercial Banking reporting unit reporting unit would have
caused the carrying amount for those reporting units to be in excess of fair value which would require the second step to be performed.
As part of our annual impairment test, we assessed our market capitalization based on the average market price relative to the
aggregate fair value of our reporting units and determined that any excess fair value in our reporting units at that time could be
attributed to a reasonable control premium compared to historical control premiums seen in the industry. During 2009, the lack of
liquidity in the financial markets and the continued economic deterioration led to a decline in market capitalization resulting in
significantly higher control premiums than what had been seen historically. Throughout 2010, our capitalization rate increased
resulting in a decline in our implied control premium. We will continue to regularly monitor our market capitalization in 2011, overall
economic conditions and other events or circumstances that may result in an impairment of goodwill in the future.
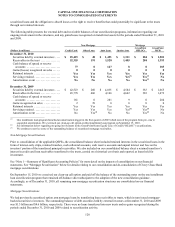
The following table provides a summary of goodwill as of December 31, 2010 and 2009:
(Dollars in millions)
Total Company National
Lending Local
Banking Credit
Card Consumer Commercial Other Total
Balance as of December 31, 2009 ... $ 0 $ 0 $ 4,693 $ 4,585 $ 4,318 $ 0 $ 13,596
Other adjustments .................... 0 0 (3) (2) 0 0 (5)
Balance as of December 31, 2010 ... $ 0 $ 0 $ 4,690 $ 4,583 $ 4,318 $ 0 $ 13,591
(Dollars in millions)
Total Company
National
Lending
Local
Banking
Credit
Card Consumer Commercial Other (1) Total
Balance as of December 31, 2008 ...... $ 5,303 $ 6,661 $ 0 $ 0 $ 0 $ 0 $ 11,964
Other adjustments .................... 9 0 1 0 (3) 0 7
Acquisition .......................... 0 0 0 0 0 1,625 1,625
Segment reorganization ............... (5,312) (6,661) 4,692 4,585 4,321 (1,625) 0
Balance as of December 31, 2009 . . . $ 0 $ 0 $ 4,693 $ 4,585 $ 4,318 $ 0 $ 13,596
________________________
(1) Goodwill attributed to the Chevy Chase Bank acquisition was initially recorded in the “Other” category until the segment reorganization.
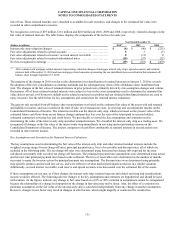
Other Intangible Assets
In connection with the acquisition of Chevy Chase Bank, we recorded intangible assets of $278 million that consisted of core deposit
intangibles, trust intangibles, lease intangibles, and other intangibles, which are subject to amortization. The core deposit and trust
intangibles reflect the estimated value of deposit and trust relationships. The lease intangibles reflect the difference between the
contractual obligation under current lease contracts and the fair market value of the lease contracts at the acquisition date. The
purchased credit card relationship reflects the difference between the purchase price and the fair value of the credit card loans acquired
in the Sony acquisition. The other intangible items relate to customer lists and brokerage relationships.
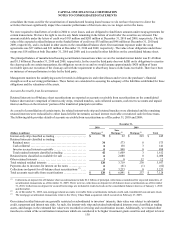
The following table summarizes our intangible assets subject to amortization:
December 31, 2010
(Dollars in millions)
Gross
Carrying
Amount Accumulated
Amortization
Net
Carrying
Amount
Remaining
Amortization
Period
Core deposit intangibles ....................................... $ 1,562 $ (912) $ 650 7.0 years
Lease intangibles ............................................ 54 (28) 26 21.7 years
Purchased credit card relationship intangible(1) .................. 47 (5) 42 6.1 years
Trust intangibles ............................................. 11 (5) 6 12.9 years
Other intangibles ............................................. 35 (26) 9 3.3 years
Total ...................................................... $ 1,709 $ (976) $ 733