Capital One 2010 Annual Report Download - page 41
Download and view the complete annual report
Please find page 41 of the 2010 Capital One annual report below. You can navigate through the pages in the report by either clicking on the pages listed below, or by using the keyword search tool below to find specific information within the annual report.-
 1
1 -
2
-
3
-
4
-
5
-
6
-
7
-
8
-
9
-
10
-
11
-
12
-
13
-
14
-
15
-
16
-
17
-
18
-
19
-
20
-
21
-
22
-
23
-
24
-
25
-
26
-
27
-
28
-
29
-
30
-
 31
31 -
 32
32 -
 33
33 -
 34
34 -
 35
35 -
 36
36 -
 37
37 -
 38
38 -
 39
39 -
 40
40 -
 41
41 -
 42
42 -
 43
43 -
 44
44 -
 45
45 -
 46
46 -
 47
47 -
 48
48 -
 49
49 -
 50
50 -
 51
51 -
52
-
53
-
54
-
55
-
56
-
57
-
58
-
59
-
60
-
61
-
62
-
63
-
64
-
65
-
66
-
67
-
68
-
69
-
70
-
71
-
72
-
73
-
74
-
75
-
76
-
77
-
78
-
79
-
80
-
81
-
82
-
83
-
84
-
85
-
86
-
87
-
88
-
89
-
90
-
91
-
92
-
93
-
94
-
95
-
96
-
97
-
98
-
99
-
100
-
101
-
102
-
103
-
104
-
105
-
106
-
107
-
108
-
109
-
110
-
111
-
112
-
113
-
114
-
115
-
116
-
117
-
118
-
119
-
120
-
121
-
122
-
123
-
124
-
125
-
126
-
127
-
128
-
129
-
130
-
131
-
132
-
133
-
134
-
135
-
136
-
137
-
138
-
139
-
140
-
141
-
142
-
143
-
144
-
145
-
146
-
147
-
148
-
149
-
150
-
151
-
152
-
153
-
154
-
155
-
156
-
157
-
158
-
159
-
160
-
161
-
162
-
163
-
164
-
165
-
166
-
167
-
168
-
169
-
170
-
171
-
172
-
173
-
174
-
175
-
176
-
177
-
178
-
179
-
180
-
181
-
182
-
183
-
184
-
185
-
186
-
187
-
188
-
189
-
190
-
191
-
192
-
193
-
194
-
195
-
196
-
197
-
198
-
199
-
200
-
201
-
202
-
203
-
204
-
205
-
206
-
207
-
208
-
209
-
210
-
211
-
212
-
213
-
214
-
215
-
216
-
217
-
218
-
219
-
220
-
221
-
222
-
223
-
224
-
225
-
226
 |
 |

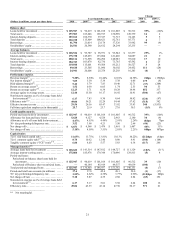
21
Change
Year Ended December 31, 2010 vs.
2009
2009 vs.
2008
(Dollars in millions, except per share data) 2010 2009(1) 2008 2007 2006(2)
Balance sheet
Loans held for investment .................... $ 125,947 $ 90,619 $ 101,018 $ 101,805 $ 96,512 39% (10)%
Total assets ................................ 197,503 169,646 165,913 150,590 149,739 16 2
Interest-bearing deposits ...................... 107,162 102,370 97,327 71,715 74,123 5 5
Total deposits .............................. 122,210 115,809 108,621 82,761 85,771 6 7
Borrowings ................................ 41,796 21,014 23,178 37,526 33,982 99 (9)
Stockholders’ equity ......................... 26,541 26,590 26,612 24,294 25,235
—
—
Average balances
Loans held for investment .................... $ 128,526 $ 99,787 $ 98,971 $ 93,542 $ 63,577 29% 1%
Interest-earning assets ........................ 175,730 145,293 133,084 121,420 84,087 21 9
Total assets ................................ 200,114 171,598 156,292 148,983 95,810 17 10
Interest-bearing deposits ...................... 104,743 103,078 82,736 73,765 45,592 2 25
Total deposits .............................. 119,010 115,601 93,508 85,212 50,527 3 24
Borrowings ................................ 49,610 23,505 31,096 30,102 24,452 111 (24)
Stockholders’ equity ......................... 24,941 26,606 25,278 25,203 16,203 (6) 5
Performance metrics
Revenue margin
(
6
)
........................... 9.20% 8.94% 10.44% 12.01% 14.38 % 26bps (150)bps
N
et interest margin
(
7
)
........................ 7.09 5.30 5.38 5.38 6.06 179 (8)
Risk-adjusted margin
(
8
)
....................... 5.42 5.79 7.83 10.40 12.71 (37) (204)
Return on average assets
(
9
)
.................... 1.52 0.58 0.05 1.74 2.53 94 53
Return on average equity
(
10
)
................... 12.23 3.71 0.34 10.28 14.98 852 337
Average equity to average assets ............... 12.46 15.50 16.17 16.92 16.91 (304) (67)
N
on-interest expense as a% of average loans held
for investment(11) .......................... 6.17 7.43 8.30 8.64 10.92 (126) (87)
Efficiency ratio
(
12
)
........................... 49.06 56.21 52.29 54.44 57.42 (715) 392
Effective income tax rate ..................... 29.56 26.16 85.47 33.02 33.93 340 (5,931)
Full-time equivalent employees (in thousands) .. . 25.7 25.9 23.7 27.0 30.3 (1)% 9%
Credit quality metrics
Period-end loans held for investment ........... $ 125,947 $ 90,619 $ 101,018 $ 101,805 $ 96,512 39% (10)%
Allowance for loan and lease losses ............ 5,628 4,127 4,524 2,963 2,180 36 (9)
Allowance as a% of loans held for investment .... 4.47% 4.55% 4.48% 2.91% 2.26 % (8)bps 7bps
30+ day performing delinquency rate ........... 3.52 3.98 4.21 3.50 2.66 (46) (23)
N
et charge-offs ............................. $ 6,651 $ 4,568 $ 3,478 $ 1,961 $ 1,407 46% 31%
N
et charge-off rate .......................... 5.18% 4.58% 3.51% 2.10% 2.21 % 60bps 107bps
Capital ratios
Tier 1 risk-based capital ratio .................. 11.63% 13.75% 13.81% 10.13% 10.22 % (212)bps (6)bps
Tier 1 common equity ratio
(
13
)
................. 8.78 10.62 12.46 8.80 8.91 (184) (184)
Tangible common equity (“TCE”) ratio
(
14
)
....... 6.86 8.03 5.57 5.83 6.38 (117) 246
Managed metrics(15)
Average loans held for investment ............. $ 128,622 $ 143,514 $ 147,812 $ 144,727 $ 111,329 (10)% (3) %
Average interest-earning assets ................ 175,804 185,976 179,348 170,496 129,813 (5) 4
Period-end loans:
Period-end on-balance sheet loans held for
investment ............................. $ 125,947 $ 90,619 $ 101,018 $ 101,805 $ 96,512 39 (10)
Period-end off-balance sheet securitized loans .. — 46,184 45,919 49,557 49,639 (100) 1
Total period-end managed loans ............... $ 125,947 $ 136,803 $ 146,937 $ 151,362 $ 146,151 (8) (7)
Period-end total loan accounts (in millions) ..... 37.4 37.8 45.4 49.1 50.0 (1) (17)
30+ day performing delinquency rate ........... 3.52% 4.62% 4.38% 3.77% 2.96 % (110)bps 24bps
N
et charge-off rate .......................... 5.18 5.87 4.35 2.88 2.84 (69) 152
N
on-interest expense as a% of average loans held
for investment(11) .......................... 6.17 5.17 5.01 5.58 6.24 100 16
Efficiency ratio ............................. 49.06 43.35 43.14 47.30 50.17 571 21
________________________
** Not meaningful.