Capital One 2010 Annual Report Download - page 140
Download and view the complete annual report
Please find page 140 of the 2010 Capital One annual report below. You can navigate through the pages in the report by either clicking on the pages listed below, or by using the keyword search tool below to find specific information within the annual report.-
 1
1 -
2
-
3
-
4
-
5
-
6
-
7
-
8
-
9
-
10
-
11
-
12
-
13
-
14
-
15
-
16
-
17
-
18
-
19
-
20
-
21
-
22
-
23
-
24
-
25
-
26
-
27
-
28
-
29
-
30
-
31
-
32
-
33
-
34
-
35
-
36
-
37
-
38
-
39
-
40
-
41
-
42
-
43
-
44
-
45
-
46
-
47
-
48
-
49
-
50
-
51
-
52
-
53
-
54
-
55
-
56
-
57
-
58
-
59
-
60
-
61
-
62
-
63
-
64
-
65
-
66
-
67
-
68
-
69
-
70
-
71
-
72
-
73
-
74
-
75
-
76
-
77
-
78
-
79
-
80
-
81
-
82
-
83
-
84
-
85
-
86
-
87
-
88
-
89
-
90
-
91
-
92
-
93
-
94
-
95
-
96
-
97
-
98
-
99
-
100
-
101
-
102
-
103
-
104
-
105
-
106
-
107
-
108
-
109
-
110
-
111
-
112
-
113
-
114
-
115
-
116
-
117
-
118
-
119
-
120
-
121
-
122
-
123
-
124
-
125
-
126
-
127
-
128
-
129
-
 130
130 -
 131
131 -
 132
132 -
 133
133 -
 134
134 -
 135
135 -
 136
136 -
 137
137 -
 138
138 -
 139
139 -
 140
140 -
 141
141 -
 142
142 -
 143
143 -
 144
144 -
 145
145 -
 146
146 -
 147
147 -
 148
148 -
 149
149 -
 150
150 -
151
-
152
-
153
-
154
-
155
-
156
-
157
-
158
-
159
-
160
-
161
-
162
-
163
-
164
-
165
-
166
-
167
-
168
-
169
-
170
-
171
-
172
-
173
-
174
-
175
-
176
-
177
-
178
-
179
-
180
-
181
-
182
-
183
-
184
-
185
-
186
-
187
-
188
-
189
-
190
-
191
-
192
-
193
-
194
-
195
-
196
-
197
-
198
-
199
-
200
-
201
-
202
-
203
-
204
-
205
-
206
-
207
-
208
-
209
-
210
-
211
-
212
-
213
-
214
-
215
-
216
-
217
-
218
-
219
-
220
-
221
-
222
-
223
-
224
-
225
-
226
 |
 |

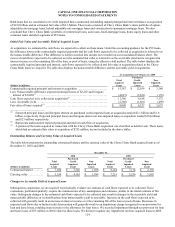
CAPITAL ONE FINANCIAL CORPORATION
NOTES TO CONSOLIDATED STATEMENTS
120
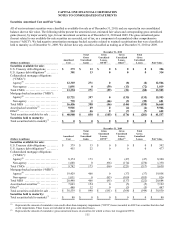
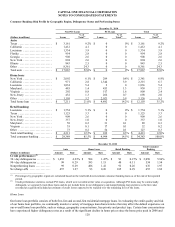
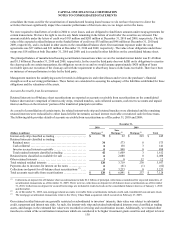
Consumer Banking: Risk Profile by Geographic Region, Delinquency Status and Performing Status
December 31, 2010
Non-PCI Loans PCI Loans Total
(Dollars in millions) Loans % of
Total(1) Loans % of
Total(1) Loans % of
Total(1)
Auto:
Texas ..........................
.
$ 3,161 9.2% $ 0 0% $ 3,161 9.2%
California ......................
.
1,412 4.1 0 0 1,412 4.1
Louisiana ......................
.
1,334 3.9 0 0 1,334 3.9
Florida .........................
.
954 2.8 0 0 954 2.8
Georgia ........................
.
908 2.6 0 0 908 2.6
N
ew York ......................
.
894 2.6 0 0 894 2.6
Illinois .........................
.
843 2.5 0 0 843 2.5
Other ..........................
.
8,361 24.3 0 0 8,361 24.3
Total auto ......................
.
$ 17,867 52.0% $ 0 0% $ 17,867 52.0%
Home loan:
N
ew York ......................
.
$ 2,092 6.1% $ 289 0.8% $ 2,381 6.9%
California ......................
.
971 2.8 1,344 3.9 2,315 6.7
Louisiana ......................
.
1,834 5.4 2 0 1,836 5.4
Maryland .......................
.
485 1.4 453 1.3 938 2.7
Virginia ........................
.
292 0.8 517 1.6 809 2.4
N
ew Jersey .....................
.
432 1.3 266 0.7 698 2.0
Other ..........................
.
1,105 3.2 2,021 5.9 3,126 9.1
Total home loan ................
.
$ 7,211 21.0% $ 4,892 14.2% $ 12,103 35.2%
Retail banking:
Louisiana ......................
.
$ 1,754 5.1% $ 0 0% $ 1,754 5.1%
Texas ..........................
.
1,125 3.3 0 0 1,125 3.3
N
ew York ......................
.
909 2.6 0 0 909 2.6
N
ew Jersey .....................
.
357 1.0 0 0 357 1.0
Maryland .......................
.
58 0.2 31 0.1 89 0.3
Virginia ........................
.
35 0.1 17 0.1 52 0.2
Other ..........................
.
73 0.2 54 0.1 127 0.3
Total retail banking .............
.
$ 4,311 12.5% $ 102 0.3% $ 4,413 12.8%
Total consumer banking .........
.
$ 29,389 85.5% $ 4,994 14.5% $ 34,383 100.0%
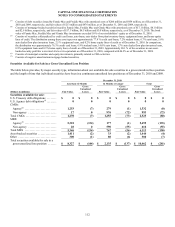
December 31, 2010
Auto Home Loan Retail Banking Total Consumer
Banking
(Dollars in millions) Amount Rate Amount Rate Amount Rate Amount Rate
Credit performance:(2)
30+ day delinquencies ........... $ 1,453 4.23% $ 504 1.47% $ 93 0.27% $ 2,050 5.96%
90+ day delinquencies ........... 99 0.29 395 1.15 40 0.11 534 1.54
N
onperforming loans ............ 99 0.29 486 1.41 91 0.26 676 1.97
N
et charge-offs ................. 457 1.27 93 0.26 105 0.29 655 1.82
________________________
(1) Percentages by geographic region are calculated based on the total held-for-investment consumer banking loans as of the end of the reported
period.
(2) Credit performance statistics exclude PCI loans, which were recorded at fair value at acquisition. Although PCI loans may be contractually
delinquent, we separately track these loans and do not include them in our delinquency and nonperforming loan statistics as the fair value
recorded at acquisition included an estimate of credit losses expected to be realized over the remaining lives of the loans.
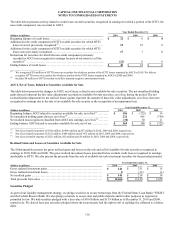
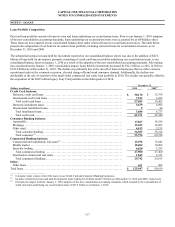
Home Loan
Our home loan portfolio consists of both first-lien and second-lien residential mortgage loans. In evaluating the credit quality and risk
of our home loan portfolio, we continually monitor a variety of mortgage loan characteristics that may affect the default experience on
our overall home loan portfolio, such as vintage, geographic concentrations, lien priority and product type. Certain loan concentrations
have experienced higher delinquency rates as a result of the significant decline in home prices since the home price peak in 2006 and