Capital One 2010 Annual Report Download - page 40
Download and view the complete annual report
Please find page 40 of the 2010 Capital One annual report below. You can navigate through the pages in the report by either clicking on the pages listed below, or by using the keyword search tool below to find specific information within the annual report.-
 1
1 -
2
-
3
-
4
-
5
-
6
-
7
-
8
-
9
-
10
-
11
-
12
-
13
-
14
-
15
-
16
-
17
-
18
-
19
-
20
-
21
-
22
-
23
-
24
-
25
-
26
-
27
-
28
-
29
-
 30
30 -
 31
31 -
 32
32 -
 33
33 -
 34
34 -
 35
35 -
 36
36 -
 37
37 -
 38
38 -
 39
39 -
 40
40 -
 41
41 -
 42
42 -
 43
43 -
 44
44 -
 45
45 -
 46
46 -
 47
47 -
 48
48 -
 49
49 -
 50
50 -
51
-
52
-
53
-
54
-
55
-
56
-
57
-
58
-
59
-
60
-
61
-
62
-
63
-
64
-
65
-
66
-
67
-
68
-
69
-
70
-
71
-
72
-
73
-
74
-
75
-
76
-
77
-
78
-
79
-
80
-
81
-
82
-
83
-
84
-
85
-
86
-
87
-
88
-
89
-
90
-
91
-
92
-
93
-
94
-
95
-
96
-
97
-
98
-
99
-
100
-
101
-
102
-
103
-
104
-
105
-
106
-
107
-
108
-
109
-
110
-
111
-
112
-
113
-
114
-
115
-
116
-
117
-
118
-
119
-
120
-
121
-
122
-
123
-
124
-
125
-
126
-
127
-
128
-
129
-
130
-
131
-
132
-
133
-
134
-
135
-
136
-
137
-
138
-
139
-
140
-
141
-
142
-
143
-
144
-
145
-
146
-
147
-
148
-
149
-
150
-
151
-
152
-
153
-
154
-
155
-
156
-
157
-
158
-
159
-
160
-
161
-
162
-
163
-
164
-
165
-
166
-
167
-
168
-
169
-
170
-
171
-
172
-
173
-
174
-
175
-
176
-
177
-
178
-
179
-
180
-
181
-
182
-
183
-
184
-
185
-
186
-
187
-
188
-
189
-
190
-
191
-
192
-
193
-
194
-
195
-
196
-
197
-
198
-
199
-
200
-
201
-
202
-
203
-
204
-
205
-
206
-
207
-
208
-
209
-
210
-
211
-
212
-
213
-
214
-
215
-
216
-
217
-
218
-
219
-
220
-
221
-
222
-
223
-
224
-
225
-
226
 |
 |

20
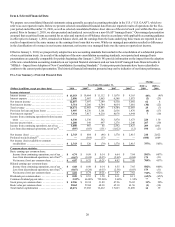
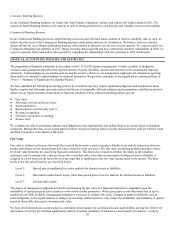
Item 6. Selected Financial Data
We prepare our consolidated financial statements using generally accepted accounting principles in the U.S. (“U.S. GAAP”), which we
refer to as our reported results. Below we present selected consolidated financial data from our reported results of operations for the five-
year period ended December 31, 2010, as well as selected consolidated balance sheet data as of the end of each year within this five-year
period. Prior to January 1, 2010, we also presented and analyzed our results on a non-GAAP “managed basis.” Our managed presentation
assumed that securitized loans accounted for as sales and reported as off-balance sheet in accordance with applicable accounting guidance
in effect prior to January 1, 2010, remained on balance sheet, and the earnings from the loans underlying these trusts are reported in our
results of operations in the same manner as the earnings from loans that we own. While our managed presentation resulted in differences
in the classification of revenues in our income statement, net income on a managed basis was the same as reported net income.
Effective January 1, 2010, we prospectively adopted two new accounting standards that resulted in the consolidation of a substantial portion
of our securitization trusts. As a result of the adoption of the new consolidation accounting standards, our reported and managed basis
presentations are generally comparable for periods beginning after January 1, 2010. We provide information on the impact from the adoption
of the new consolidation accounting standards on our reported financial statements and our non-GAAP managed basis financial results in
“MD&A—Impact from Adoption of New Consolidation Accounting Standards.” Certain prior period amounts have been reclassified to
conform to the current period presentation. The historical financial information presented may not be indicative of our future performance.
Five-Year Summary of Selected Financial Data
Change
Year Ended December 31, 2010 vs.
2009
2009 vs.
2008
(Dollars in millions, except per share data) 2010 2009(1) 2008 2007 2006(2)
Income statement
Interest income ............................. $ 15,353 $ 10,664 $ 11,112 $ 11,078 $ 8,165 44% (4)%
Interest expense ............................ 2,896 2,967 3,963 4,548 3,073 (2) (25)
N
et interest income ......................... 12,457 7,697 7,149 6,530 5,092 62 8
N
on-interest income ......................... 3,714 5,286 6,744 8,054 7,001 (30) (22)
Total revenue .............................. 16,171 12,983 13,893 14,584 12,093 25 (7)
Provision for loan and lease losses ............. 3,907 4,230 5,101 2,636 1,476 (8) (17)
N
on-interest expense
(
3
)
....................... 7,934 7,417 8,210 8,078 6,944 7 (10)
Income from continuing operations before income
taxes ................................... 4,330 1,336 582 3,870 3,673 224 130
Income tax provision ........................ 1,280 349 497 1,278 1,246 267 (30)
Income from continuing operations, net of tax . . . 3,050 987 85 2,592 2,427 209 1,061
Loss from discontinued operations, net of tax
(
4
)
.. . (307) (103) (131) (1,022) (12) 198 (21)
N
et income (loss) ........................... $ 2,743 $ 884 $ (46) $ 1,570 $ 2,415 210 2,022
Preferred stock dividends
(
5
)
................... — (564) (33)
—
—
(100) 1,609
N
et income (loss) available to common
stockholders ............................. $ 2,743 $ 320 $ (79) $ 1,570 $ 2,415 757% 505%
Common share statistics
Basic earnings per common share:
Income from continuing operations, net of tax . $ 6.74 $ 0.99 $ 0.14 $ 6.64 $ 7.84 581% 607%
Loss from discontinued operations, net of tax
(
4
)
. (0.67) (0.24) (0.35) (2.62) (0.04) 179 (31)
Net income (loss) per common share ......... $ 6.07 $ 0.75 $ (0.21) $ 4.02 $ 7.80 709% 457%
Diluted earnings per common share:
Income from continuing operations, net of tax . $ 6.68 $ 0.98 $ 0.14 $ 6.55 $ 7.65 582% 600%
Loss from discontinued operations, net of tax
(
4
)
. (0.67) (0.24) (0.35) (2.58) (0.03) 179 (31)
Net income (loss) per common share ......... $ 6.01 $ 0.74 $ (0.21) $ 3.97 $ 7.62 712% 452%
Dividends per common share ................. $ 0.20 $ 0.53 $ 1.50 $ 0.11 $ 0.11 (62)% (65)%
Common dividend payout ratio ................ 3.32% 66.80% 722.06% 2.68% 1.34% ** **
Stock price per common share ................ $ 42.56 $ 38.34 31.89 47.26 76.82 11% 20%
Book value per common share ................ 58.62 59.04 68.38 65.18 61.56 (1) (14)
Total market capitalization ................... 19,271 17,268 12,412 17,623 31,489 12 39