Capital One 2010 Annual Report Download - page 63
Download and view the complete annual report
Please find page 63 of the 2010 Capital One annual report below. You can navigate through the pages in the report by either clicking on the pages listed below, or by using the keyword search tool below to find specific information within the annual report.-
 1
1 -
2
-
3
-
4
-
5
-
6
-
7
-
8
-
9
-
10
-
11
-
12
-
13
-
14
-
15
-
16
-
17
-
18
-
19
-
20
-
21
-
22
-
23
-
24
-
25
-
26
-
27
-
28
-
29
-
30
-
31
-
32
-
33
-
34
-
35
-
36
-
37
-
38
-
39
-
40
-
41
-
42
-
43
-
44
-
45
-
46
-
47
-
48
-
49
-
50
-
51
-
52
-
 53
53 -
 54
54 -
 55
55 -
 56
56 -
 57
57 -
 58
58 -
 59
59 -
 60
60 -
 61
61 -
 62
62 -
 63
63 -
 64
64 -
 65
65 -
 66
66 -
 67
67 -
 68
68 -
 69
69 -
 70
70 -
 71
71 -
 72
72 -
 73
73 -
74
-
75
-
76
-
77
-
78
-
79
-
80
-
81
-
82
-
83
-
84
-
85
-
86
-
87
-
88
-
89
-
90
-
91
-
92
-
93
-
94
-
95
-
96
-
97
-
98
-
99
-
100
-
101
-
102
-
103
-
104
-
105
-
106
-
107
-
108
-
109
-
110
-
111
-
112
-
113
-
114
-
115
-
116
-
117
-
118
-
119
-
120
-
121
-
122
-
123
-
124
-
125
-
126
-
127
-
128
-
129
-
130
-
131
-
132
-
133
-
134
-
135
-
136
-
137
-
138
-
139
-
140
-
141
-
142
-
143
-
144
-
145
-
146
-
147
-
148
-
149
-
150
-
151
-
152
-
153
-
154
-
155
-
156
-
157
-
158
-
159
-
160
-
161
-
162
-
163
-
164
-
165
-
166
-
167
-
168
-
169
-
170
-
171
-
172
-
173
-
174
-
175
-
176
-
177
-
178
-
179
-
180
-
181
-
182
-
183
-
184
-
185
-
186
-
187
-
188
-
189
-
190
-
191
-
192
-
193
-
194
-
195
-
196
-
197
-
198
-
199
-
200
-
201
-
202
-
203
-
204
-
205
-
206
-
207
-
208
-
209
-
210
-
211
-
212
-
213
-
214
-
215
-
216
-
217
-
218
-
219
-
220
-
221
-
222
-
223
-
224
-
225
-
226
 |
 |

43
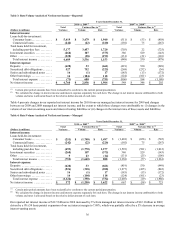
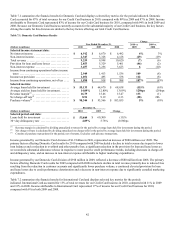
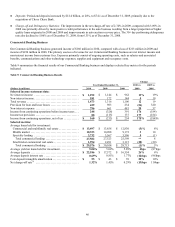
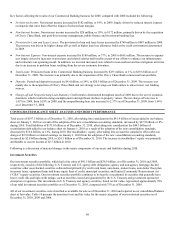
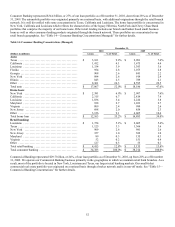
Table 7.2: International Card Business Results
Change
Year Ended December 31, 2010 vs.
2009
2009 vs.
2008
(Dollars in millions) 2010 2009 2008
Selected income statement data:
N
et interest income ............................ $ 982 $ 872 $ 972 13% (10)%
N
on-interest income ............................ 373 419 550 (11) (24)
Total revenue .................................. 1,355 1,291 1,522 5 (15)
Provision for loan and lease losses ............... 335 722 647 (53) 12
N
on-interest expense ........................... 494 482 770 2 (37)
Income from continuing operations before income
taxes ........................................ 526 87 105 505 (17)
Income tax provision ........................... 150 27 36 456 (25)
Income from continuing operations, net of tax .... $ 376 $ 60 $ 69 527% (13)%
Selected metrics:
Average loans held for investment ............... $ 7,499 $ 8,405 $ 10,571 (11)% (20)%
Average yield on loans held for investment ....... 16.33% 13.71% 13.88% 262bps (17)bps
Revenue margin(1) .............................. 18.07 15.36 14.40 271 96
N
et charge-off rate(2) ........................... 7.89 8.83 5.77 (94) 306
Purchase volume(3) ............................. $ 8,568 $ 8,502 $ 10,800 1% (21)%
December 31,
(Dollars in millions) 2010 2009 Change
Selected period-end data:
Loans held for investment ...................... $ 7,522 $ 8,224 (9)%
30+ day delinquency rate ....................... 5.75% 6.55% (80)bps
________________________
(1) Revenue margin is calculated by dividing annualized revenues for the period by average loans held for investment during the period.
(2) Net charge-off rate is calculated by dividing annualized net charge-offs for the period by average loans held for investment during the period.
(3) Consists of purchase transactions for the period, net of returns. Excludes cash advance transactions.
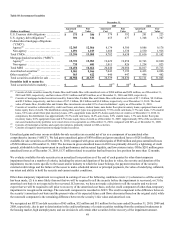
Income generated by our International Card division of $376 million in 2010 increased $316 million from 2009. The most significant
driver of the improvement in results was a $386 million decrease in the provision for loan and lease losses in 2010. As a result of
decreases in charge-off and delinquency rates, we recorded a substantial allowance release of $256 million in 2010, compared with an
allowance release of $20 million in 2009. In addition, total revenue increased by $64 million, primarily due to the impact of pricing
changes implemented during 2009 that resulted in increases in average asset yields that were partially offset by a decline in loan
balances.
Income generated by our International Card division of $60 million in 2009 decreased by $9 million from 2008, attributable to a
decrease in total revenue and an increase in the provision for loan and lease losses that more than offset a reduction in non-interest
expense. The decline in revenue was due to the combined impact of foreign exchange fluctuations and a decline in customer accounts,
which resulted in lower fees. Although loan balances declined, the provision for loan and lease losses increased due to deterioration in
credit performance during 2009 as a result of weak economic conditions in Canada and the U.K.
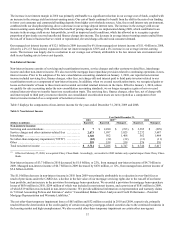
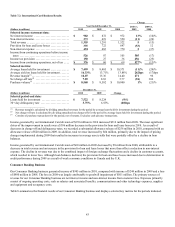
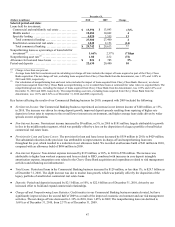
Consumer Banking Business
Our Consumer Banking business generated income of $905 million in 2010, compared with income of $244 million in 2009 and a loss
of $980 million in 2008. The loss in 2008 was largely attributable to goodwill impairment of $811 million. The primary sources of
revenue for our Consumer Banking business are net interest income and non-interest income from customer fees. Expenses primarily
consist of ongoing operating costs, such as salaries and associated benefits, communications and other technology expenses, supplies
and equipment and occupancy costs.
Table 8 summarizes the financial results of our Consumer Banking business and displays selected key metrics for the periods indicated.