Capital One 2010 Annual Report Download - page 141
Download and view the complete annual report
Please find page 141 of the 2010 Capital One annual report below. You can navigate through the pages in the report by either clicking on the pages listed below, or by using the keyword search tool below to find specific information within the annual report.-
 1
1 -
2
-
3
-
4
-
5
-
6
-
7
-
8
-
9
-
10
-
11
-
12
-
13
-
14
-
15
-
16
-
17
-
18
-
19
-
20
-
21
-
22
-
23
-
24
-
25
-
26
-
27
-
28
-
29
-
30
-
31
-
32
-
33
-
34
-
35
-
36
-
37
-
38
-
39
-
40
-
41
-
42
-
43
-
44
-
45
-
46
-
47
-
48
-
49
-
50
-
51
-
52
-
53
-
54
-
55
-
56
-
57
-
58
-
59
-
60
-
61
-
62
-
63
-
64
-
65
-
66
-
67
-
68
-
69
-
70
-
71
-
72
-
73
-
74
-
75
-
76
-
77
-
78
-
79
-
80
-
81
-
82
-
83
-
84
-
85
-
86
-
87
-
88
-
89
-
90
-
91
-
92
-
93
-
94
-
95
-
96
-
97
-
98
-
99
-
100
-
101
-
102
-
103
-
104
-
105
-
106
-
107
-
108
-
109
-
110
-
111
-
112
-
113
-
114
-
115
-
116
-
117
-
118
-
119
-
120
-
121
-
122
-
123
-
124
-
125
-
126
-
127
-
128
-
129
-
130
-
 131
131 -
 132
132 -
 133
133 -
 134
134 -
 135
135 -
 136
136 -
 137
137 -
 138
138 -
 139
139 -
 140
140 -
 141
141 -
 142
142 -
 143
143 -
 144
144 -
 145
145 -
 146
146 -
 147
147 -
 148
148 -
 149
149 -
 150
150 -
 151
151 -
152
-
153
-
154
-
155
-
156
-
157
-
158
-
159
-
160
-
161
-
162
-
163
-
164
-
165
-
166
-
167
-
168
-
169
-
170
-
171
-
172
-
173
-
174
-
175
-
176
-
177
-
178
-
179
-
180
-
181
-
182
-
183
-
184
-
185
-
186
-
187
-
188
-
189
-
190
-
191
-
192
-
193
-
194
-
195
-
196
-
197
-
198
-
199
-
200
-
201
-
202
-
203
-
204
-
205
-
206
-
207
-
208
-
209
-
210
-
211
-
212
-
213
-
214
-
215
-
216
-
217
-
218
-
219
-
220
-
221
-
222
-
223
-
224
-
225
-
226
 |
 |

CAPITAL ONE FINANCIAL CORPORATION
NOTES TO CONSOLIDATED STATEMENTS
121
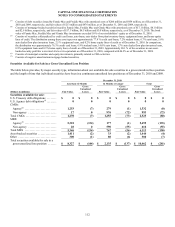
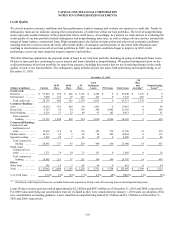
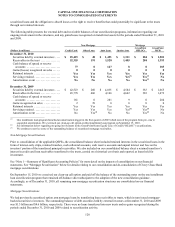
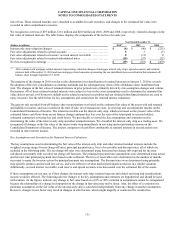
rise in unemployment. These loan concentrations include loans originated during 2008, 2007 and 2006 in an environment of
decreasing home sales, broadly declining home prices and more relaxed underwriting standards and loans on properties in Arizona,
California, Florida and Nevada, which have experienced the most severe decline in home prices. The following table presents the
distribution of our home loan portfolio as of December 31, 2010 based on selected key risk characteristics.
Home Loan: Risk Profile by Vintage, Geography, Lien Priority and Interest Rate Type
December 31, 2010
Non-PCI Loans PCI Loans Total Home Loans
(Dollars in millions) Amount
% of
Total(1) Amount
% of
Total(1) Amount
% of
Total(1)
Origination year:
< = 2005 ............................. $ 4,581 37.9% $ 2,164 17.8% $ 6,745 55.7%
2006 ................................. 940 7.7 1,007 8.3 1,947 16.0
2007 ................................. 691 5.7 1,377 11.4 2,068 17.1
2008 ................................. 327 2.7 336 2.8 663 5.5
2009 ................................. 299 2.5 8 0.1 307 2.6
2010 ................................. 373 3.1 0 0.0 373 3.1
Total ............................... $ 7,211 59.6% $ 4,892 40.4% $ 12,103 100.0%
Geographic concentration:(2)
New York ............................ $ 2,092 17.3% $ 289 2.4% $ 2,381 19.7%
California ............................ 971 8.0 1,344 11.1 2,315 19.1
Louisiana ............................ 1,834 15.2 2 0.0 1,836 15.2
Maryland ............................. 485 4.0 453 3.7 938 7.7
Virginia .............................. 292 2.4 517 4.3 809 6.7
New Jersey ........................... 432 3.5 266 2.2 698 5.7
Texas ................................ 507 4.2 31 0.3 538 4.5
Florida ............................... 148 1.2 278 2.2 426 3.4
District of Columbia .................. 103 0.9 128 1.1 231 2.0
Connecticut .......................... 110 0.9 83 0.7 193 1.6
Other ................................ 237 2.0 1,501 12.4 1,738 14.4
Total ............................... $ 7,211 59.6% $ 4,892 40.4% $ 12,103 100.0%
Lien type:
1s
t
lien ............................... $ 5,696 47.1% $ 4,556 37.6% $ 10,252 84.7%
2n
d
lien ............................... 1,515 12.5 336 2.8 1,851 15.3
Total ............................... $ 7,211 59.6% $ 4,892 40.4% $ 12,103 100.0%
Interest rate type:
Fixed rate ............................ $ 3,707 30.6% $ 138 1.2% $ 3,845 31.8%
Adjustable rate ........................ 3,504 29.0 4,754 39.2 8,258 68.2
Total ............................... $ 7,211 59.6% $ 4,892 40.4% $ 12,103 100.0%
________________________
(1) Percentages within each risk category calculated based on total held-for-investment home loans.
(2) Represents the top ten states in which we have the highest concentration of home loans.
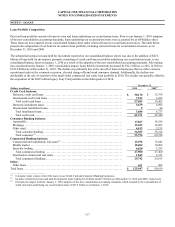
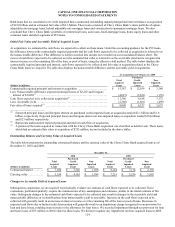
Commercial Banking
We evaluate the credit risk of commercial loans individually and use a risk-rating system to determine the credit quality of our
commercial loans. We assign internal risk grades to loans based on relevant information about the ability of borrowers to service their
debt. In determining the risk rating of a particular loan, among the factors considered are the borrower’s current financial condition,
historical credit performance, projected future credit performance, prospects for support from financially responsible guarantors, the
estimated realizable value of any collateral and current economic trends. The ratings scale based on our internal risk-rating system is
as follows:
● Noncriticized: Loans that have not been designated as criticized, frequently referred to as “pass” loans.
● Criticized performing: Loans in which the financial condition of the obligor is stressed, affecting earnings, cash flows or collateral
values. The borrower currently has adequate capacity to meet near-term obligations; however, the stress, left unabated, my result
in deterioration of the repayment prospects at some future date.