Capital One 2010 Annual Report Download - page 193
Download and view the complete annual report
Please find page 193 of the 2010 Capital One annual report below. You can navigate through the pages in the report by either clicking on the pages listed below, or by using the keyword search tool below to find specific information within the annual report.-
 1
1 -
2
-
3
-
4
-
5
-
6
-
7
-
8
-
9
-
10
-
11
-
12
-
13
-
14
-
15
-
16
-
17
-
18
-
19
-
20
-
21
-
22
-
23
-
24
-
25
-
26
-
27
-
28
-
29
-
30
-
31
-
32
-
33
-
34
-
35
-
36
-
37
-
38
-
39
-
40
-
41
-
42
-
43
-
44
-
45
-
46
-
47
-
48
-
49
-
50
-
51
-
52
-
53
-
54
-
55
-
56
-
57
-
58
-
59
-
60
-
61
-
62
-
63
-
64
-
65
-
66
-
67
-
68
-
69
-
70
-
71
-
72
-
73
-
74
-
75
-
76
-
77
-
78
-
79
-
80
-
81
-
82
-
83
-
84
-
85
-
86
-
87
-
88
-
89
-
90
-
91
-
92
-
93
-
94
-
95
-
96
-
97
-
98
-
99
-
100
-
101
-
102
-
103
-
104
-
105
-
106
-
107
-
108
-
109
-
110
-
111
-
112
-
113
-
114
-
115
-
116
-
117
-
118
-
119
-
120
-
121
-
122
-
123
-
124
-
125
-
126
-
127
-
128
-
129
-
130
-
131
-
132
-
133
-
134
-
135
-
136
-
137
-
138
-
139
-
140
-
141
-
142
-
143
-
144
-
145
-
146
-
147
-
148
-
149
-
150
-
151
-
152
-
153
-
154
-
155
-
156
-
157
-
158
-
159
-
160
-
161
-
162
-
163
-
164
-
165
-
166
-
167
-
168
-
169
-
170
-
171
-
172
-
173
-
174
-
175
-
176
-
177
-
178
-
179
-
180
-
181
-
182
-
 183
183 -
 184
184 -
 185
185 -
 186
186 -
 187
187 -
 188
188 -
 189
189 -
 190
190 -
 191
191 -
 192
192 -
 193
193 -
 194
194 -
 195
195 -
 196
196 -
 197
197 -
 198
198 -
 199
199 -
 200
200 -
 201
201 -
 202
202 -
 203
203 -
204
-
205
-
206
-
207
-
208
-
209
-
210
-
211
-
212
-
213
-
214
-
215
-
216
-
217
-
218
-
219
-
220
-
221
-
222
-
223
-
224
-
225
-
226
 |
 |

CAPITAL ONE FINANCIAL CORPORATION
NOTES TO CONSOLIDATED STATEMENTS
173
documentation, monoline bond insurers typically initiate litigation. Accordingly, our reserves for the Active Insured Securitization
category are not based upon the historical repurchase rate with monoline bond insurers, but rather upon the expected resolution of
litigation with the monoline bond insurers. Every bond insurer within this category is pursuing a substantially similar litigation
strategy either through active or probable litigation. Accordingly, our representation and warranty reserves for this category are
litigation reserves. In establishing litigation reserves for this category, we consider current and future losses inherent within the
securitization and apply legal judgment to the anticipated factual and legal record to estimate the lifetime legal liability for each
securitization. Our estimated legal liability for each securitization within this category assumes that we will be responsible for only a
portion of the losses inherent in each securitization. Our litigation reserves with respect to both the U.S. Bank Lawsuit and the DBSP
Lawsuit, in each case as discussed below, are contained within the Active Insured Securitization reserve category. Further, our
litigation reserves with respect to indemnification risks from certain representation and warranty lawsuits brought by monoline bond
insurers against third-party securitizations sponsors, where GreenPoint provided some or all of the mortgage collateral within the
securitization but is not a defendant in the litigation, are also contained within this category.
For the $5 billion original principal balance of mortgage loans in the Inactive Insured Securitizations category and the $82 billion
original principal balance of mortgage loans in the Uninsured Securitizations and other whole loans sales category, we establish
reserves by relying on our historical repurchase rates to estimate repurchase liabilities for these categories over the next twelve (12)
months. We do not believe we can estimate repurchase liability for these categories for a period longer than 12 months because of the
relatively sporadic nature of repurchase requests from these categories. Although we have not seen any significant activity from new
counterparties from these categories, there has been a recent uptick in negotiation intensity from some counterparties who had
submitted repurchase claims in earlier quarters with respect to whole loans. In addition, some Uninsured Securitization investors from
this category have not made repurchase requests or filed representation and warranty lawsuits, but instead have filed class actions
under federal and state securities laws against investment banks and securitization sponsors. Although we face some indemnity risks
from these litigations, we have not established reserves with respect to these indemnity risks because we do not consider them to be
both probable and reasonably estimable liabilities.
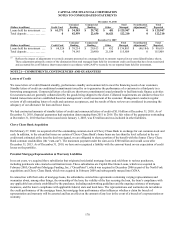
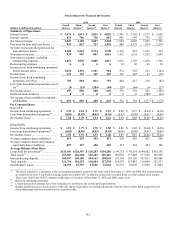
The aggregate reserves for all three subsidiaries were $816 million as of December 31, 2010 as compared with $238 million as of
December 31, 2009. We recorded a total provision for repurchase losses for our representation and warranty repurchase exposure of
$636 million for the year ended December 31, 2010. During 2010, we had settlements of repurchase requests totaling $58 million that
were charged against the reserve. The table below summarizes changes in our representation and warranty reserves for the twelve
months ended December 31, 2010 and 2009.
Changes in Representation and Warranty Reserves
Year Ended December 31,
(Dollars in millions) 2010 2009
Representation and warranty repurchase reserve, beginning of period(1) ..........................
.
$ 238 $ 140
Provision for repurchase losses(2) .............................................................
.
636(3) 181
N
et realized losses ..........................................................................
.
(58) (83)
Representation and warranty repurchase reserve, end of period(1) ................................
.
$ 816 $ 238
________________________
(1) Reported in our consolidated balance sheets as a component of other liabilities.
(2) The portion of the provision for mortgage repurchase claims recognized in our consolidated statements of income as a component of non-
interest income totaled $204 million and $19 million for the twelve months ended December 31, 2010 and 2009. The portion of the provision for
mortgage repurchase claims recognized in our consolidated statements of income as a component of discontinued operations totaled $432
million and $162 million, pre-tax, for the twelve months ended December 31, 2010 and 2009.
(3) Includes increases to the representation and warranty reserves in the first and second quarter of 2010 due primarily to counterparty activity and
our ability to extend the timeframe over which we estimate our repurchase liability for mortgage loans sold by our subsidiaries to GSEs and
those mortgage loans placed into Active Insured Securitizations for the full life of the mortgage loans sold by our subsidiaries for groups of
loans for which we believe repurchases are probable. More specifically, of the $636 million increase in representation and warranty reserves for
the twelve months ended December 31, 2010, approximately $407 million resulted from our ability to extend repurchase liability estimates to
the life of the loan effective in the second quarter of 2010. The remaining $229 million related primarily to changing counterparty activity in the
form of updated estimates around active and probable litigation, most of which occurred in the first quarter of 2010.
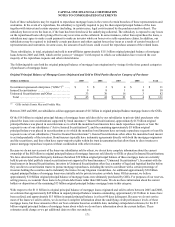
As indicated in the table below, almost all of the reserves relate to the $11 billion in original principal balance of mortgage loans sold
directly to the GSEs and to the $13 billion in mortgage loans sold to purchasers who placed them into Active Insured Securitizations.