Capital One 2010 Annual Report Download - page 109
Download and view the complete annual report
Please find page 109 of the 2010 Capital One annual report below. You can navigate through the pages in the report by either clicking on the pages listed below, or by using the keyword search tool below to find specific information within the annual report.-
 1
1 -
2
-
3
-
4
-
5
-
6
-
7
-
8
-
9
-
10
-
11
-
12
-
13
-
14
-
15
-
16
-
17
-
18
-
19
-
20
-
21
-
22
-
23
-
24
-
25
-
26
-
27
-
28
-
29
-
30
-
31
-
32
-
33
-
34
-
35
-
36
-
37
-
38
-
39
-
40
-
41
-
42
-
43
-
44
-
45
-
46
-
47
-
48
-
49
-
50
-
51
-
52
-
53
-
54
-
55
-
56
-
57
-
58
-
59
-
60
-
61
-
62
-
63
-
64
-
65
-
66
-
67
-
68
-
69
-
70
-
71
-
72
-
73
-
74
-
75
-
76
-
77
-
78
-
79
-
80
-
81
-
82
-
83
-
84
-
85
-
86
-
87
-
88
-
89
-
90
-
91
-
92
-
93
-
94
-
95
-
96
-
97
-
98
-
 99
99 -
 100
100 -
 101
101 -
 102
102 -
 103
103 -
 104
104 -
 105
105 -
 106
106 -
 107
107 -
 108
108 -
 109
109 -
 110
110 -
 111
111 -
 112
112 -
 113
113 -
 114
114 -
 115
115 -
 116
116 -
 117
117 -
 118
118 -
 119
119 -
120
-
121
-
122
-
123
-
124
-
125
-
126
-
127
-
128
-
129
-
130
-
131
-
132
-
133
-
134
-
135
-
136
-
137
-
138
-
139
-
140
-
141
-
142
-
143
-
144
-
145
-
146
-
147
-
148
-
149
-
150
-
151
-
152
-
153
-
154
-
155
-
156
-
157
-
158
-
159
-
160
-
161
-
162
-
163
-
164
-
165
-
166
-
167
-
168
-
169
-
170
-
171
-
172
-
173
-
174
-
175
-
176
-
177
-
178
-
179
-
180
-
181
-
182
-
183
-
184
-
185
-
186
-
187
-
188
-
189
-
190
-
191
-
192
-
193
-
194
-
195
-
196
-
197
-
198
-
199
-
200
-
201
-
202
-
203
-
204
-
205
-
206
-
207
-
208
-
209
-
210
-
211
-
212
-
213
-
214
-
215
-
216
-
217
-
218
-
219
-
220
-
221
-
222
-
223
-
224
-
225
-
226
 |
 |

89
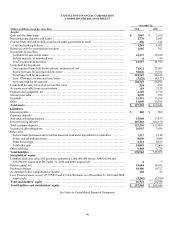
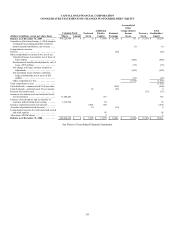
CAPITAL ONE FINANCIAL CORPORATION
CONSOLIDATED STATEMENTS OF INCOME
Year Ended December 31,
(Dollars in millions, except per share data) 2010 2009 2008
Interest income:
Loans held for investment, including past-due fees ..............................
.
$ 13,934 $ 8,757 $ 9,460
Investment securities .........................................................
.
1,342 1,610 1,224
Other .......................................................................
.
77 297 428
Total interest income .......................................................
.
15,353 10,664 11,112
Interest expense:
Deposits ....................................................................
.
1,465 2,093 2,512
Securitized debt obligations ...................................................
.
809 282 550
Senior and subordinated notes .................................................
.
276 260 445
Other borrowings ............................................................
.
346 332 456
Total interest expense ......................................................
.
2,896 2,967 3,963
Net interest income ........................................................
.
12,457 7,697 7,149
Provision for loan and lease losses .............................................
.
3,907 4,230 5,101
Net interest income after provision for loan and lease losses ...................
.
8,550 3,467 2,048
Non-interest income:
Servicing and securitizations ..................................................
.
7 2,280 3,385
Service charges and other customer-related fees ................................
.
2,073 1,997 2,232
Interchange fees .............................................................
.
1,340 502 562
Total other-than-temporary losses .............................................
.
(128) (287) (11)
Less: Non-credit component of other-than-temporary losses recorded in AOCI ....
.
63 255 0
N
et othe
r
-than-temporary impairment losses recognized in earnings ..............
.
(65) (32) (11)
Other .......................................................................
.
359 539 576
Total non-interest income ...................................................
.
3,714 5,286 6,744
Non-interest expense:
Salaries and associate benefits .................................................
.
2,594 2,478 2,336
Marketing ...................................................................
.
958 588 1,118
Communications and data processing ..........................................
.
693 740 756
Supplies and equipment ......................................................
.
520 500 520
Occupancy ..................................................................
.
486 451 377
Restructuring expense(1) ......................................................
.
0 119 134
Other .......................................................................
.
2,683 2,541 2,969
Total non-interest expense ..................................................
.
7,934 7,417 8,210
Income from continuing operations before income taxes .........................
.
4,330 1,336 582
Income tax provision .........................................................
.
1,280 349 497
Income from continuing operations, net of tax ................................
.
3,050 987 85
Loss from discontinued operations, net of tax ...................................
.
(307) (103) (131)
Net income ................................................................
.
2,743 884 (46)
Preferred stock dividends .....................................................
.
0 (564) (33)
N
et income (loss) available to common stockholders ............................
.
$ 2,743 $ 320 $ (79)
Basic earnings per common share:
Income from continuing operations ............................................
.
$ 6.74 $ 0.99 $ 0.14
Loss from discontinued operations .............................................
.
(0.67) (0.24) (0.35)
Net income (loss) per basic common share ...................................
.
$ 6.07 $ 0.75 $ (0.21)
Diluted earnings per common share:
Income from continuing operations ............................................
.
$ 6.68 $ 0.98 $ 0.14
Loss from discontinued operations .............................................
.
(0.67) (0.24) (0.35)
Net income (loss) per diluted common share .................................
.
$ 6.01 $ 0.74 $ (0.21)
Dividends paid per common share .............................................
.
$ 0.20 $ 0.53 $ 1.50
________________________
(1) In 2009, we completed the restructuring of operations that was initiated in 2007 to reduce expenses and improve our competitive cost position.
See Notes to Consolidated Financial Statements.