Capital One 2010 Annual Report Download - page 45
Download and view the complete annual report
Please find page 45 of the 2010 Capital One annual report below. You can navigate through the pages in the report by either clicking on the pages listed below, or by using the keyword search tool below to find specific information within the annual report.-
 1
1 -
2
-
3
-
4
-
5
-
6
-
7
-
8
-
9
-
10
-
11
-
12
-
13
-
14
-
15
-
16
-
17
-
18
-
19
-
20
-
21
-
22
-
23
-
24
-
25
-
26
-
27
-
28
-
29
-
30
-
31
-
32
-
33
-
34
-
 35
35 -
 36
36 -
 37
37 -
 38
38 -
 39
39 -
 40
40 -
 41
41 -
 42
42 -
 43
43 -
 44
44 -
 45
45 -
 46
46 -
 47
47 -
 48
48 -
 49
49 -
 50
50 -
 51
51 -
 52
52 -
 53
53 -
 54
54 -
 55
55 -
56
-
57
-
58
-
59
-
60
-
61
-
62
-
63
-
64
-
65
-
66
-
67
-
68
-
69
-
70
-
71
-
72
-
73
-
74
-
75
-
76
-
77
-
78
-
79
-
80
-
81
-
82
-
83
-
84
-
85
-
86
-
87
-
88
-
89
-
90
-
91
-
92
-
93
-
94
-
95
-
96
-
97
-
98
-
99
-
100
-
101
-
102
-
103
-
104
-
105
-
106
-
107
-
108
-
109
-
110
-
111
-
112
-
113
-
114
-
115
-
116
-
117
-
118
-
119
-
120
-
121
-
122
-
123
-
124
-
125
-
126
-
127
-
128
-
129
-
130
-
131
-
132
-
133
-
134
-
135
-
136
-
137
-
138
-
139
-
140
-
141
-
142
-
143
-
144
-
145
-
146
-
147
-
148
-
149
-
150
-
151
-
152
-
153
-
154
-
155
-
156
-
157
-
158
-
159
-
160
-
161
-
162
-
163
-
164
-
165
-
166
-
167
-
168
-
169
-
170
-
171
-
172
-
173
-
174
-
175
-
176
-
177
-
178
-
179
-
180
-
181
-
182
-
183
-
184
-
185
-
186
-
187
-
188
-
189
-
190
-
191
-
192
-
193
-
194
-
195
-
196
-
197
-
198
-
199
-
200
-
201
-
202
-
203
-
204
-
205
-
206
-
207
-
208
-
209
-
210
-
211
-
212
-
213
-
214
-
215
-
216
-
217
-
218
-
219
-
220
-
221
-
222
-
223
-
224
-
225
-
226
 |
 |

25
Because we prospectively adopted the new consolidation accounting standards, our historical reported results and consolidated
financial statements for periods prior to January 1, 2010 reflect our securitization trusts as off-balance sheet in accordance with the
applicable accounting guidance in effect during this period. Accordingly, our reported results and consolidated financial statements
subsequent to January 1, 2010 are not presented on a basis consistent with our reported results and consolidated financial statements
for periods prior to January 1, 2010. This inconsistency limits the comparability of our post-January 1, 2010 reported results to our
prior period reported results.
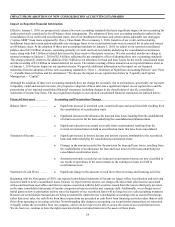
Impact on Non-GAAP Managed Financial Information
In addition to analyzing our results on a reported basis, management historically evaluated our total company and business segment
results on a non-GAAP “managed” basis. Our managed presentations reflected the results from both our on-balance sheet loans and
off-balance sheet loans and excluded the impact of card securitization activity. Our managed presentations assumed that our
securitized loans had not been sold and that the earnings from securitized loans were classified in our results of operations in the same
manner as the earnings on loans that we owned. Our managed results also reflected differences in accounting for the valuation of
retained interests and the recognition of gains and losses on the sale of interest-only strips. Our managed results did not include the
addition of an allowance for loan and lease losses for the loans underlying our off-balance sheet securitization trusts. While our
managed presentation resulted in differences in the classification of revenues in our income statement, net income on a managed basis
was the same as reported net income.
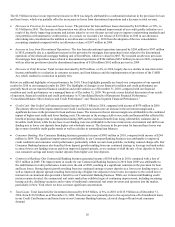
Prior to January 1, 2010, we used our non-GAAP managed basis presentation to evaluate the credit performance and overall financial
performance of our entire managed loan portfolio because the same underwriting standards and ongoing risk monitoring are used for
both securitized loans and loans that we own. In addition, we used the managed presentation as the basis for making decisions about
funding our operations and allocating resources, such as employees and capital. Because management used our managed basis
presentation to evaluate our performance, we also provided this information to investors. We believed that our managed basis
information was useful to investors because it portrayed the results of both on- and off-balance sheet loans that we managed, which
enabled investors to understand the credit risks associated with the portfolio of loans reported on our consolidated balance sheet and
our retained interests in securitized loans.
In periods prior to January 1, 2010, certain of our non-GAAP managed measures differed from the comparable reported measures. The
adoption on January 1, 2010 of the new consolidation accounting standards resulted in accounting for the loans in our securitization
trusts in our reported financial statements in a manner similar to how we account for these loans on a managed basis. As a result, our
reported and managed basis presentations are generally comparable for periods beginning after January 1, 2010.
We believe that investors will be able to better understand our financial results and evaluate trends in our business if our period-over-
period data are reflected on a more comparable basis. Accordingly, unless otherwise noted, this MD&A compares our reported U.S.
GAAP financial information as of and for the year ended December 31, 2010 with our non-GAAP managed based financial
information as of and for the years ended December 31, 2009 and 2008. We provide a reconciliation of our non-GAAP managed
based information for periods prior to January 1, 2010 to the most comparable reported U.S. GAAP information in “Exhibit 99.1.”
EXECUTIVE SUMMARY AND BUSINESS OUTLOOK
We continued to operate in an environment of elevated economic and regulatory uncertainty during 2010. The overall economic
recovery remained modest and fragile. The unemployment rate remained persistently high at close to 10% and the housing market
continued to struggle, due in part to the large backlog of homes in the foreclosure process and high rate of delinquent loans. The
ongoing and expected development of new regulations and regulatory organizations resulting from the recently enacted Dodd-
Frank Act contributed to continued regulatory uncertainty.
Despite the challenges presented by these conditions, we began to see some stabilization in loan volumes, as well as improvements in
our credit results that outpaced the economic recovery during 2010. Each of our businesses performed well during the year, generating
net income of $2.7 billion ($6.01 per diluted share) in 2010, which represented a substantial increase of $1.9 billion over our reported
net income of $884 million ($0.74 per diluted share) in 2009. We provide highlights of our 2010 financial performance below.
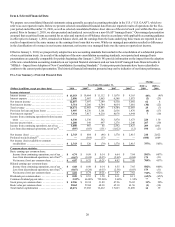
Financial Highlights
As noted above, the presentation of our results on a non-GAAP managed basis prior to January 1, 2010 assumed that our securitized
loans had not been sold and that the earnings from securitized loans were classified in our results of operations in the same manner as
the earnings on loans that we owned. These classification differences resulted in differences in certain revenue and expense
components of our results of operations on a reported basis and our results of operations on a managed basis, although net income for
both basis was the same. We provide a summary of our managed results for 2009 and 2008 in “Note 20 — Business Segments.”